

| << Chapter < Page | Chapter >> Page > |
Let denote the left-endpoint sum using n subintervals and let denote the corresponding right-endpoint sum. In the following exercises, compute the indicated left and right sums for the given functions on the indicated interval.
L 4 for on
L 6 for on
R 4 for on
R 4 for on
Compute the left and right Riemann sums— L 4 and R 4 , respectively—for on Compute their average value and compare it with the area under the graph of f .
Compute the left and right Riemann sums— L 6 and R 6 , respectively—for on Compute their average value and compare it with the area under the graph of f .
The graph of f is a triangle with area 9.
Compute the left and right Riemann sums— L 4 and R 4 , respectively—for on and compare their values.
Compute the left and right Riemann sums— L 6 and R 6 , respectively—for on and compare their values.
They are equal.
Express the following endpoint sums in sigma notation but do not evaluate them.
L 30 for on
R 20 for on
In the following exercises, graph the function then use a calculator or a computer program to evaluate the following left and right endpoint sums. Is the area under the curve between the left and right endpoint sums?
[T] L 100 and R 100 for on the interval
[T] L 100 and R 100 for on the interval
![A graph of the given function on the interval [0, 1]. It is set up for a left endpoint approximation and is an underestimate because the function is increasing. Ten rectangles are shown for visual clarity, but this behavior persists for more rectangles.](/ocw/mirror/col11964/m53624/CNX_Calc_Figure_05_01_207.jpg)
The plot shows that the left Riemann sum is an underestimate because the function is increasing. Similarly, the right Riemann sum is an overestimate. The area lies between the left and right Riemann sums. Ten rectangles are shown for visual clarity. This behavior persists for more rectangles.
[T] L 50 and R 50 for on the interval
[T] L 100 and R 100 for on the interval
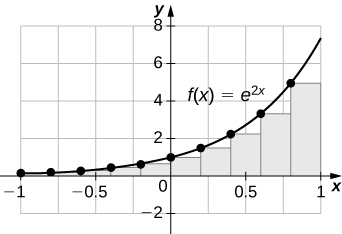
![A graph of the given function over [-1,1] set up for a left endpoint approximation. It is an underestimate since the function is increasing. Ten rectangles are shown for visual clarity, but this behavior persists for more rectangles.](/ocw/mirror/col11964/m53624/CNX_Calc_Figure_05_01_209.jpg)
The left endpoint sum is an underestimate because the function is increasing. Similarly, a right endpoint approximation is an overestimate. The area lies between the left and right endpoint estimates.
[T] L 50 and R 50 for on the interval
[T] L 100 and R 100 for on the interval
The plot shows that the left Riemann sum is an underestimate because the function is increasing. Ten rectangles are shown for visual clarity. This behavior persists for more rectangles.
Let t j denote the time that it took Tejay van Garteren to ride the j th stage of the Tour de France in 2014. If there were a total of 21 stages, interpret
Let denote the total rainfall in Portland on the j th day of the year in 2009. Interpret
The sum represents the cumulative rainfall in January 2009.
Let denote the hours of daylight and denote the increase in the hours of daylight from day to day j in Fargo, North Dakota, on the j th day of the year. Interpret
To help get in shape, Joe gets a new pair of running shoes. If Joe runs 1 mi each day in week 1 and adds mi to his daily routine each week, what is the total mileage on Joe’s shoes after 25 weeks?
The total mileage is
Notification Switch
Would you like to follow the 'Calculus volume 1' conversation and receive update notifications?

|
|

|
|

|
|

|
|
|
|
|

|
|

|
|

|
|

|
|

|