| << Chapter < Page | Chapter >> Page > |
| t | |
|---|---|
| 0.1 | a. |
| 0.01 | b. |
| 0.001 | c. |
| 0.0001 | d. |
| x | x | ||
|---|---|---|---|
| 1.9 | a. | 2.1 | e. |
| 1.99 | b. | 2.01 | f. |
| 1.999 | c. | 2.001 | g. |
| 1.9999 | d. | 2.0001 | h. |
a. 0.13495277; b. 0.12594300; c. 0.12509381; d. 0.12500938; e. 0.11614402; f. 0.12406794; g. 0.12490631; h. 0.12499063;
[T] In the following exercises, set up a table of values and round to eight significant digits. Based on the table of values, make a guess about what the limit is. Then, use a calculator to graph the function and determine the limit. Was the conjecture correct? If not, why does the method of tables fail?
| θ | θ | ||
|---|---|---|---|
| −0.1 | a. | 0.1 | e. |
| −0.01 | b. | 0.01 | f. |
| −0.001 | c. | 0.001 | g. |
| −0.0001 | d. | 0.0001 | h. |
| a | |
|---|---|
| 0.1 | a. |
| 0.01 | b. |
| 0.001 | c. |
| 0.0001 | d. |
a. −10.00000; b. −100.00000; c. −1000.0000; d. −10,000.000; Guess:
actual: DNE
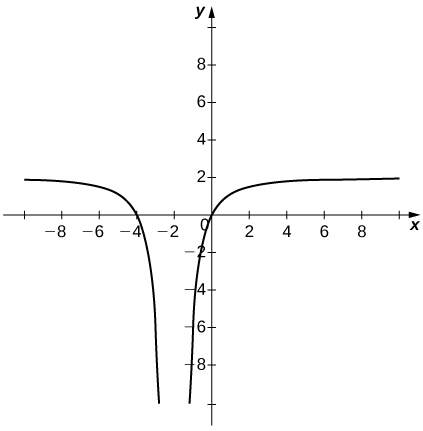
![A graph of the function (1/alpha) * cos (pi / alpha), which oscillates gently until the interval [-.2, .2], where it oscillates rapidly, going to infinity and negative infinity as it approaches the y axis.](/ocw/mirror/col11964/m53491/CNX_Calc_Figure_02_02_214.jpg)
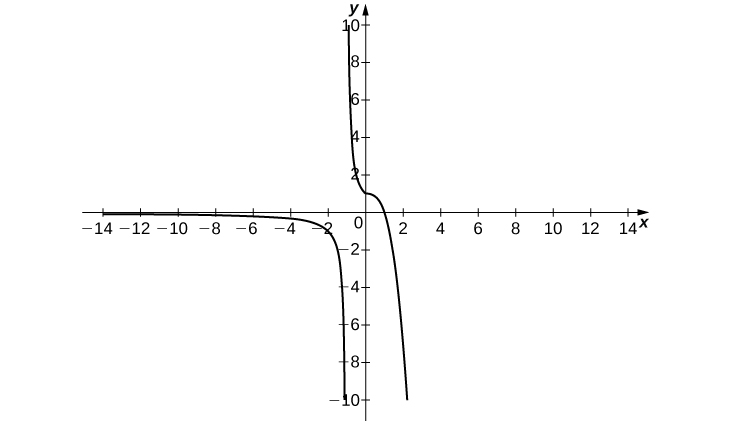
In the following exercises, consider the graph of the function shown here. Which of the statements about are true and which are false? Explain why a statement is false.
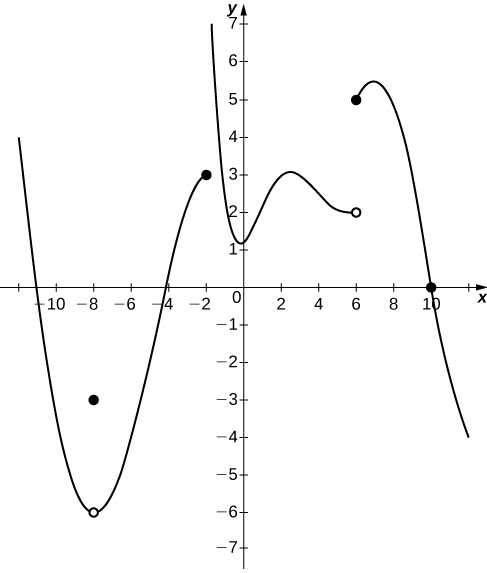
In the following exercises, use the following graph of the function to find the values, if possible. Estimate when necessary.
In the following exercises, use the graph of the function shown here to find the values, if possible. Estimate when necessary.
In the following exercises, use the graph of the function shown here to find the values, if possible. Estimate when necessary.
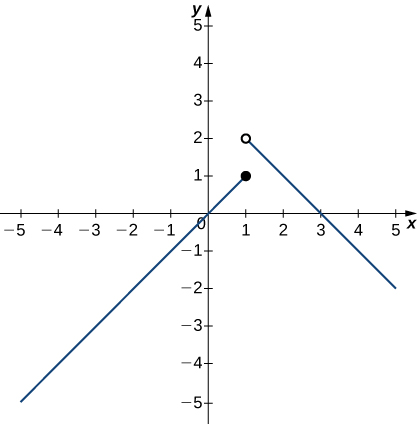
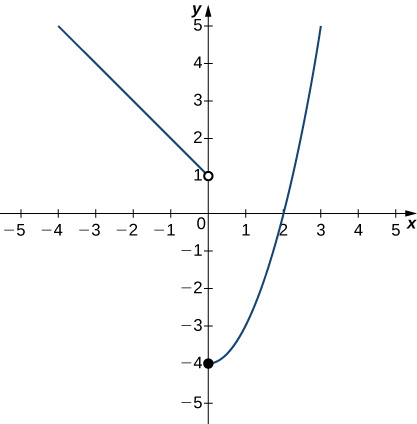
![A graph of a piecewise function with three segments, all linear. The first exists for x < -2, has a slope of 1, and ends at the open circle at (-2, 0). The second exists over the interval [-2, 2], has a slope of -1, goes through the origin, and has closed circles at its endpoints (-2, 2) and (2,-2). The third exists for x>2, has a slope of 1, and begins at the open circle (2,2).](/ocw/mirror/col11964/m53491/CNX_Calc_Figure_02_02_204.jpg)
In the following exercises, use the graph of the function shown here to find the values, if possible. Estimate when necessary.
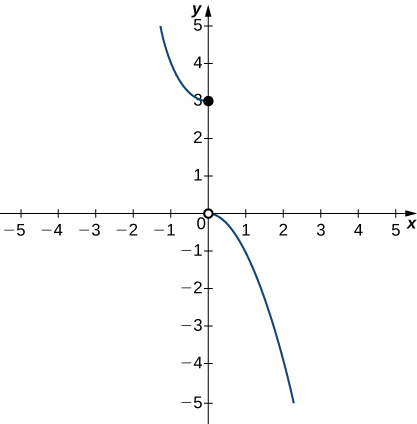
In the following exercises, use the graph of the function shown here to find the values, if possible. Estimate when necessary.
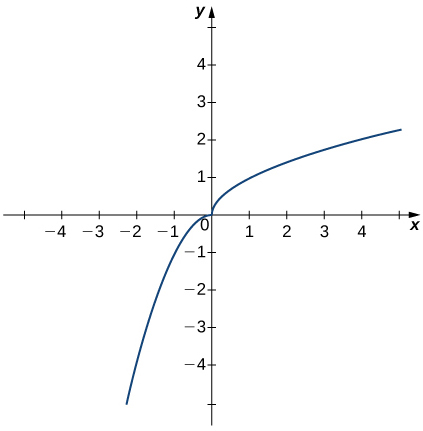
In the following exercises, use the graph of the function shown here to find the values, if possible. Estimate when necessary.
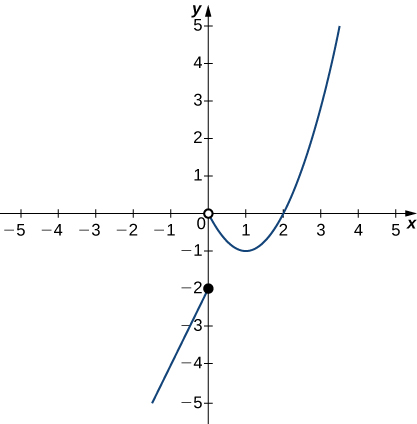
In the following exercises, sketch the graph of a function with the given properties.
is not defined.
Shock waves arise in many physical applications, ranging from supernovas to detonation waves. A graph of the density of a shock wave with respect to distance, x , is shown here. We are mainly interested in the location of the front of the shock, labeled in the diagram.
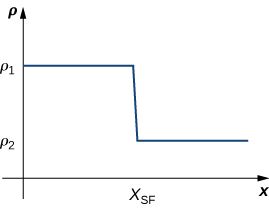
a. b. c. DNE unless As you approach from the right, you are in the high-density area of the shock. When you approach from the left, you have not experienced the “shock” yet and are at a lower density.
A track coach uses a camera with a fast shutter to estimate the position of a runner with respect to time. A table of the values of position of the athlete versus time is given here, where x is the position in meters of the runner and t is time in seconds. What is What does it mean physically?
| t (sec) | x (m) |
|---|---|
| 1.75 | 4.5 |
| 1.95 | 6.1 |
| 1.99 | 6.42 |
| 2.01 | 6.58 |
| 2.05 | 6.9 |
| 2.25 | 8.5 |
Notification Switch
Would you like to follow the 'Calculus volume 1' conversation and receive update notifications?

|
|

|
|

|
|

|
|

|
|

|
|

|
|

|
|

|
|

|