<< Chapter < Page Chapter >> Page >
  • Determine the conditions for when a function has an inverse.
  • Use the horizontal line test to recognize when a function is one-to-one.
  • Find the inverse of a given function.
  • Draw the graph of an inverse function.
  • Evaluate inverse trigonometric functions.

An inverse function reverses the operation done by a particular function. In other words, whatever a function does, the inverse function undoes it. In this section, we define an inverse function formally and state the necessary conditions for an inverse function to exist. We examine how to find an inverse function and study the relationship between the graph of a function and the graph of its inverse. Then we apply these ideas to define and discuss properties of the inverse trigonometric functions.

Existence of an inverse function

We begin with an example. Given a function f and an output y = f ( x ) , we are often interested in finding what value or values x were mapped to y by f . For example, consider the function f ( x ) = x 3 + 4 . Since any output y = x 3 + 4 , we can solve this equation for x to find that the input is x = y 4 3 . This equation defines x as a function of y . Denoting this function as f −1 , and writing x = f −1 ( y ) = y 4 3 , we see that for any x in the domain of f , f −1 ( f ( x ) ) = f −1 ( x 3 + 4 ) = x . Thus, this new function, f −1 , “undid” what the original function f did. A function with this property is called the inverse function of the original function.
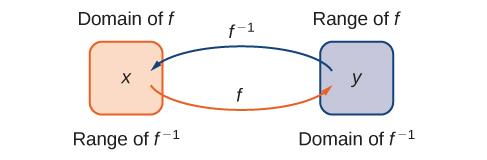
Definition

Given a function f with domain D and range R , its inverse function    (if it exists) is the function f −1 with domain R and range D such that f −1 ( y ) = x if f ( x ) = y . In other words, for a function f and its inverse f −1 ,

f −1 ( f ( x ) ) = x for all x in D , and f ( f −1 ( y ) ) = y for all y in R .

Note that f −1 is read as “f inverse.” Here, the −1 is not used as an exponent and f −1 ( x ) 1 / f ( x ) . [link] shows the relationship between the domain and range of f and the domain and range of f −1 .

An image of two bubbles. The first bubble is orange and has two labels: the top label is “Domain of f” and the bottom label is “Range of f inverse”. Within this bubble is the variable “x”. An orange arrow with the label “f” points from this bubble to the second bubble. The second bubble is blue and has two labels: the top label is “range of f” and the bottom label is “domain of f inverse”. Within this bubble is the variable “y”. A blue arrow with the label “f inverse” points from this bubble to the first bubble.
Given a function f and its inverse f −1 , f −1 ( y ) = x if and only if f ( x ) = y . The range of f becomes the domain of f −1 and the domain of f becomes the range of f −1 .

Recall that a function has exactly one output for each input. Therefore, to define an inverse function, we need to map each input to exactly one output. For example, let’s try to find the inverse function for f ( x ) = x 2 . Solving the equation y = x 2 for x , we arrive at the equation x = ± y . This equation does not describe x as a function of y because there are two solutions to this equation for every y > 0 . The problem with trying to find an inverse function for f ( x ) = x 2 is that two inputs are sent to the same output for each output y > 0 . The function f ( x ) = x 3 + 4 discussed earlier did not have this problem. For that function, each input was sent to a different output. A function that sends each input to a different output is called a one-to-one function.

Definition

We say a f is a one-to-one function    if f ( x 1 ) f ( x 2 ) when x 1 x 2 .

One way to determine whether a function is one-to-one is by looking at its graph. If a function is one-to-one, then no two inputs can be sent to the same output. Therefore, if we draw a horizontal line anywhere in the x y -plane, according to the horizontal line test    , it cannot intersect the graph more than once. We note that the horizontal line test is different from the vertical line test. The vertical line test determines whether a graph is the graph of a function. The horizontal line test determines whether a function is one-to-one ( [link] ).

Questions & Answers

differentiate between demand and supply giving examples
Lambiv Reply
differentiated between demand and supply using examples
Lambiv
what is labour ?
Lambiv
how will I do?
Venny Reply
how is the graph works?I don't fully understand
Rezat Reply
information
Eliyee
devaluation
Eliyee
t
WARKISA
hi guys good evening to all
Lambiv
multiple choice question
Aster Reply
appreciation
Eliyee
explain perfect market
Lindiwe Reply
In economics, a perfect market refers to a theoretical construct where all participants have perfect information, goods are homogenous, there are no barriers to entry or exit, and prices are determined solely by supply and demand. It's an idealized model used for analysis,
Ezea
What is ceteris paribus?
Shukri Reply
other things being equal
AI-Robot
When MP₁ becomes negative, TP start to decline. Extuples Suppose that the short-run production function of certain cut-flower firm is given by: Q=4KL-0.6K2 - 0.112 • Where is quantity of cut flower produced, I is labour input and K is fixed capital input (K-5). Determine the average product of lab
Kelo
Extuples Suppose that the short-run production function of certain cut-flower firm is given by: Q=4KL-0.6K2 - 0.112 • Where is quantity of cut flower produced, I is labour input and K is fixed capital input (K-5). Determine the average product of labour (APL) and marginal product of labour (MPL)
Kelo
yes,thank you
Shukri
Can I ask you other question?
Shukri
what is monopoly mean?
Habtamu Reply
What is different between quantity demand and demand?
Shukri Reply
Quantity demanded refers to the specific amount of a good or service that consumers are willing and able to purchase at a give price and within a specific time period. Demand, on the other hand, is a broader concept that encompasses the entire relationship between price and quantity demanded
Ezea
ok
Shukri
how do you save a country economic situation when it's falling apart
Lilia Reply
what is the difference between economic growth and development
Fiker Reply
Economic growth as an increase in the production and consumption of goods and services within an economy.but Economic development as a broader concept that encompasses not only economic growth but also social & human well being.
Shukri
production function means
Jabir
What do you think is more important to focus on when considering inequality ?
Abdisa Reply
any question about economics?
Awais Reply
sir...I just want to ask one question... Define the term contract curve? if you are free please help me to find this answer 🙏
Asui
it is a curve that we get after connecting the pareto optimal combinations of two consumers after their mutually beneficial trade offs
Awais
thank you so much 👍 sir
Asui
In economics, the contract curve refers to the set of points in an Edgeworth box diagram where both parties involved in a trade cannot be made better off without making one of them worse off. It represents the Pareto efficient allocations of goods between two individuals or entities, where neither p
Cornelius
In economics, the contract curve refers to the set of points in an Edgeworth box diagram where both parties involved in a trade cannot be made better off without making one of them worse off. It represents the Pareto efficient allocations of goods between two individuals or entities,
Cornelius
Suppose a consumer consuming two commodities X and Y has The following utility function u=X0.4 Y0.6. If the price of the X and Y are 2 and 3 respectively and income Constraint is birr 50. A,Calculate quantities of x and y which maximize utility. B,Calculate value of Lagrange multiplier. C,Calculate quantities of X and Y consumed with a given price. D,alculate optimum level of output .
Feyisa Reply
Answer
Feyisa
c
Jabir
the market for lemon has 10 potential consumers, each having an individual demand curve p=101-10Qi, where p is price in dollar's per cup and Qi is the number of cups demanded per week by the i th consumer.Find the market demand curve using algebra. Draw an individual demand curve and the market dema
Gsbwnw Reply
suppose the production function is given by ( L, K)=L¼K¾.assuming capital is fixed find APL and MPL. consider the following short run production function:Q=6L²-0.4L³ a) find the value of L that maximizes output b)find the value of L that maximizes marginal product
Abdureman
types of unemployment
Yomi Reply
What is the difference between perfect competition and monopolistic competition?
Mohammed
Got questions? Join the online conversation and get instant answers!
Jobilize.com Reply
Practice Key Terms 5

Get Jobilize Job Search Mobile App in your pocket Now!

Get it on Google Play Download on the App Store Now


Source:  OpenStax, Calculus volume 1. OpenStax CNX. Feb 05, 2016 Download for free at http://cnx.org/content/col11964/1.2
Google Play and the Google Play logo are trademarks of Google Inc.

Notification Switch

Would you like to follow the 'Calculus volume 1' conversation and receive update notifications?

Ask