<< Chapter < Page Chapter >> Page >

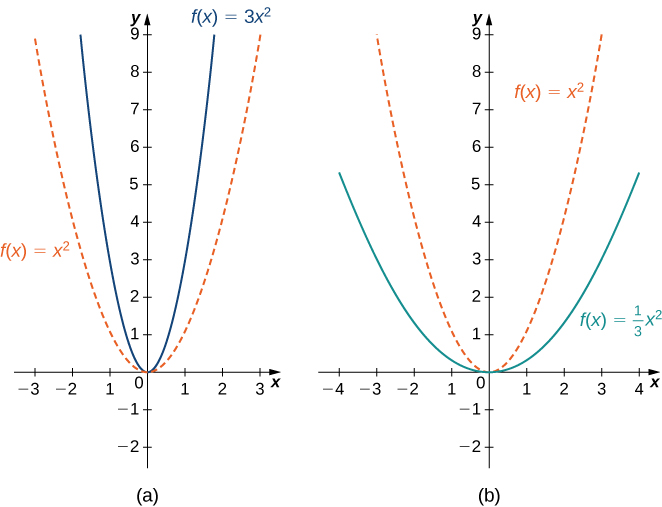
A vertical scaling of a graph occurs if we multiply all outputs y of a function by the same positive constant. For c > 0 , the graph of the function c f ( x ) is the graph of f ( x ) scaled vertically by a factor of c . If c > 1 , the values of the outputs for the function c f ( x ) are larger than the values of the outputs for the function f ( x ) ; therefore, the graph has been stretched vertically. If 0 < c < 1 , then the outputs of the function c f ( x ) are smaller, so the graph has been compressed. For example, the graph of the function f ( x ) = 3 x 2 is the graph of y = x 2 stretched vertically by a factor of 3, whereas the graph of f ( x ) = x 2 / 3 is the graph of y = x 2 compressed vertically by a factor of 3 ( [link] ).

An image of two graphs. The first graph is labeled “a” and has an x axis that runs from -3 to 3 and a y axis that runs from -2 to 9. The graph is of two functions. The first function is “f(x) = x squared”, which is a parabola that decreases until the origin and then increases again after the origin. The second function is “f(x) = 3(x squared)”, which is a parabola that decreases until the origin and then increases again after the origin, but is vertically stretched and thus increases at a quicker rate than the first function. The second graph is labeled “b” and has an x axis that runs from -4 to 4 and a y axis that runs from -2 to 9. The graph is of two functions. The first function is “f(x) = x squared”, which is a parabola that decreases until the origin and then increases again after the origin. The second function is “f(x) = (1/3)(x squared)”, which is a parabola that decreases until the origin and then increases again after the origin, but is vertically compressed and thus increases at a slower rate than the first function.
(a) If c > 1 , the graph of y = c f ( x ) is a vertical stretch of the graph of y = f ( x ) . (b) If 0 < c < 1 , the graph of y = c f ( x ) is a vertical compression of the graph of y = f ( x ) .

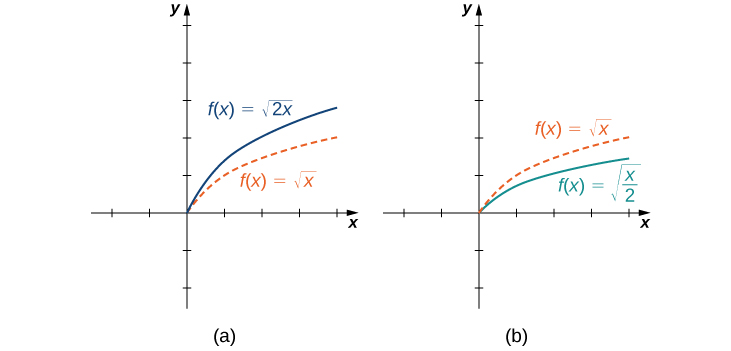
The horizontal scaling of a function occurs if we multiply the inputs x by the same positive constant. For c > 0 , the graph of the function f ( c x ) is the graph of f ( x ) scaled horizontally by a factor of c . If c > 1 , the graph of f ( c x ) is the graph of f ( x ) compressed horizontally. If 0 < c < 1 , the graph of f ( c x ) is the graph of f ( x ) stretched horizontally. For example, consider the function f ( x ) = 2 x and evaluate f at x / 2 . Since f ( x / 2 ) = x , the graph of f ( x ) = 2 x is the graph of y = x compressed horizontally. The graph of y = x / 2 is a horizontal stretch of the graph of y = x ( [link] ).

An image of two graphs. Both graphs have an x axis that runs from -2 to 4 and a y axis that runs from -2 to 5. The first graph is labeled “a” and is of two functions. The first graph is of two functions. The first function is “f(x) = square root of x”, which is a curved function that begins at the origin and increases. The second function is “f(x) = square root of 2x”, which is a curved function that begins at the origin and increases, but increases at a faster rate than the first function. The second graph is labeled “b” and is of two functions. The first function is “f(x) = square root of x”, which is a curved function that begins at the origin and increases. The second function is “f(x) = square root of (x/2)”, which is a curved function that begins at the origin and increases, but increases at a slower rate than the first function.
(a) If c > 1 , the graph of y = f ( c x ) is a horizontal compression of the graph of y = f ( x ) . (b) If 0 < c < 1 , the graph of y = f ( c x ) is a horizontal stretch of the graph of y = f ( x ) .

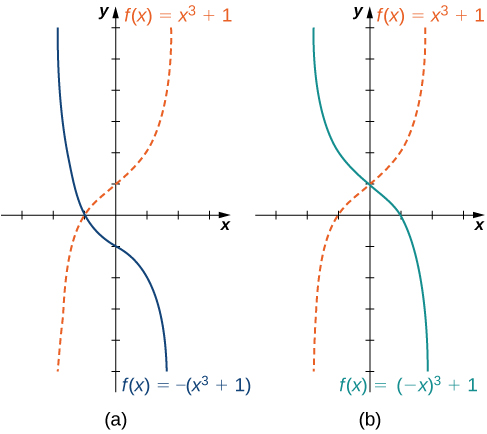
We have explored what happens to the graph of a function f when we multiply f by a constant c > 0 to get a new function c f ( x ) . We have also discussed what happens to the graph of a function f when we multiply the independent variable x by c > 0 to get a new function f ( c x ) . However, we have not addressed what happens to the graph of the function if the constant c is negative. If we have a constant c < 0 , we can write c as a positive number multiplied by −1 ; but, what kind of transformation do we get when we multiply the function or its argument by −1 ? When we multiply all the outputs by −1 , we get a reflection about the x -axis. When we multiply all inputs by −1 , we get a reflection about the y -axis. For example, the graph of f ( x ) = ( x 3 + 1 ) is the graph of y = ( x 3 + 1 ) reflected about the x -axis. The graph of f ( x ) = ( x ) 3 + 1 is the graph of y = x 3 + 1 reflected about the y -axis ( [link] ).

An image of two graphs. Both graphs have an x axis that runs from -3 to 3 and a y axis that runs from -5 to 6. The first graph is labeled “a” and is of two functions. The first graph is of two functions. The first function is “f(x) = x cubed + 1”, which is a curved increasing function that has an x intercept at (-1, 0) and a y intercept at (0, 1). The second function is “f(x) = -(x cubed + 1)”, which is a curved decreasing function that has an x intercept at (-1, 0) and a y intercept at (0, -1). The second graph is labeled “b” and is of two functions. The first function is “f(x) = x cubed + 1”, which is a curved increasing function that has an x intercept at (-1, 0) and a y intercept at (0, 1). The second function is “f(x) = (-x) cubed + 1”, which is a curved decreasing function that has an x intercept at (1, 0) and a y intercept at (0, 1). The first function increases at the same rate the second function decreases for the same values of x.
(a) The graph of y = f ( x ) is the graph of y = f ( x ) reflected about the x -axis. (b) The graph of y = f ( x ) is the graph of y = f ( x ) reflected about the
y -axis.

If the graph of a function consists of more than one transformation of another graph, it is important to transform the graph in the correct order. Given a function f ( x ) , the graph of the related function y = c f ( a ( x + b ) ) + d can be obtained from the graph of y = f ( x ) by performing the transformations in the following order.

  1. Horizontal shift of the graph of y = f ( x ) . If b > 0 , shift left. If b < 0 , shift right.
  2. Horizontal scaling of the graph of y = f ( x + b ) by a factor of | a | . If a < 0 , reflect the graph about the y -axis.
  3. Vertical scaling of the graph of y = f ( a ( x + b ) ) by a factor of | c | . If c < 0 , reflect the graph about the x -axis.
  4. Vertical shift of the graph of y = c f ( a ( x + b ) ) . If d > 0 , shift up. If d < 0 , shift down.

Questions & Answers

what is biology
Hajah Reply
the study of living organisms and their interactions with one another and their environments
AI-Robot
what is biology
Victoria Reply
HOW CAN MAN ORGAN FUNCTION
Alfred Reply
the diagram of the digestive system
Assiatu Reply
allimentary cannel
Ogenrwot
How does twins formed
William Reply
They formed in two ways first when one sperm and one egg are splited by mitosis or two sperm and two eggs join together
Oluwatobi
what is genetics
Josephine Reply
Genetics is the study of heredity
Misack
how does twins formed?
Misack
What is manual
Hassan Reply
discuss biological phenomenon and provide pieces of evidence to show that it was responsible for the formation of eukaryotic organelles
Joseph Reply
what is biology
Yousuf Reply
the study of living organisms and their interactions with one another and their environment.
Wine
discuss the biological phenomenon and provide pieces of evidence to show that it was responsible for the formation of eukaryotic organelles in an essay form
Joseph Reply
what is the blood cells
Shaker Reply
list any five characteristics of the blood cells
Shaker
lack electricity and its more savely than electronic microscope because its naturally by using of light
Abdullahi Reply
advantage of electronic microscope is easily and clearly while disadvantage is dangerous because its electronic. advantage of light microscope is savely and naturally by sun while disadvantage is not easily,means its not sharp and not clear
Abdullahi
cell theory state that every organisms composed of one or more cell,cell is the basic unit of life
Abdullahi
is like gone fail us
DENG
cells is the basic structure and functions of all living things
Ramadan
What is classification
ISCONT Reply
is organisms that are similar into groups called tara
Yamosa
in what situation (s) would be the use of a scanning electron microscope be ideal and why?
Kenna Reply
A scanning electron microscope (SEM) is ideal for situations requiring high-resolution imaging of surfaces. It is commonly used in materials science, biology, and geology to examine the topography and composition of samples at a nanoscale level. SEM is particularly useful for studying fine details,
Hilary
cell is the building block of life.
Condoleezza Reply
Got questions? Join the online conversation and get instant answers!
Jobilize.com Reply

Get Jobilize Job Search Mobile App in your pocket Now!

Get it on Google Play Download on the App Store Now


Source:  OpenStax, Calculus volume 1. OpenStax CNX. Feb 05, 2016 Download for free at http://cnx.org/content/col11964/1.2
Google Play and the Google Play logo are trademarks of Google Inc.

Notification Switch

Would you like to follow the 'Calculus volume 1' conversation and receive update notifications?

Ask