<< Chapter < Page Chapter >> Page >

Now consider a cubic function f ( x ) = a x 3 + b x 2 + c x + d . If a > 0 , then f ( x ) as x and f ( x ) −∞ as x −∞ . If a < 0 , then f ( x ) −∞ as x and f ( x ) as x −∞ . As we can see from both of these graphs, the leading term of the polynomial determines the end behavior. (See [link] (b).)

An image of two graphs. The first graph is labeled “a” and has an x axis that runs from -4 to 5 and a y axis that runs from -4 to 6. The graph contains two functions. The first function is “f(x) = -(x squared) - 4x -4”, which is a parabola. The function increasing until it hits the maximum at the point (-2, 0) and then begins decreasing. The x intercept is at (-2, 0) and the y intercept is at (0, -4). The second function is “f(x) = 2(x squared) -12x + 16”, which is a parabola. The function decreases until it hits the minimum point at (3, -2) and then begins increasing. The x intercepts are at (2, 0) and (4, 0) and the y intercept is not shown. The second graph is labeled “b” and has an x axis that runs from -4 to 3 and a y axis that runs from -4 to 6. The graph contains two functions. The first function is “f(x) = -(x cubed) - 3(x squared) + x + 3”. The graph decreases until the approximate point at (-2.2, -3.1), then increases until the approximate point at (0.2, 3.1), then begins decreasing again. The x intercepts are at (-3, 0), (-1, 0), and (1, 0). The y intercept is at (0, 3). The second function is “f(x) = (x cubed) -3(x squared) + 3x - 1”. It is a curved function that increases until the point (1, 0), where it levels out. After this point, the function begins increasing again. It has an x intercept at (1, 0) and a y intercept at (0, -1).
(a) For a quadratic function, if the leading coefficient a > 0 , the parabola opens upward. If a < 0 , the parabola opens downward. (b) For a cubic function f , if the leading coefficient a > 0 , the values f ( x ) as x and the values f ( x ) −∞ as x −∞ . If the leading coefficient a < 0 , the opposite is true.

Zeros of polynomial functions

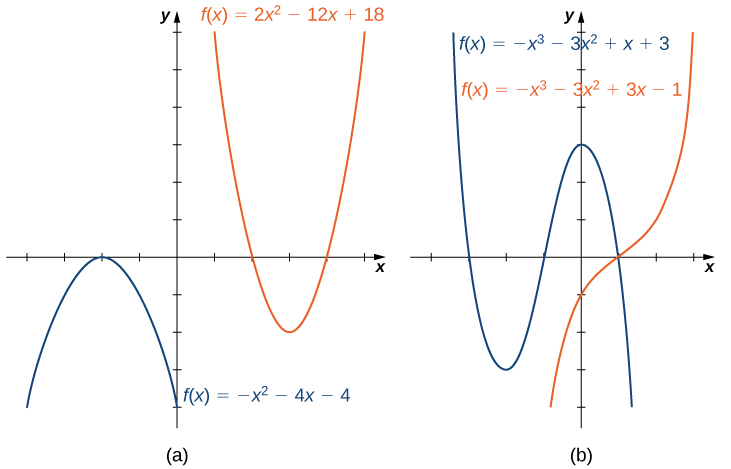
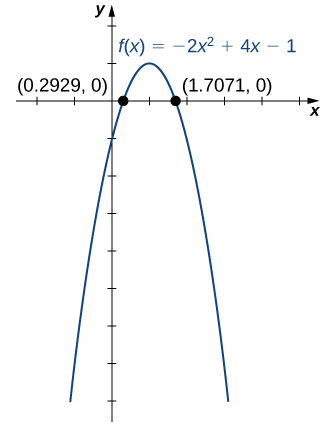
Another characteristic of the graph of a polynomial function is where it intersects the x -axis. To determine where a function f intersects the x -axis, we need to solve the equation f ( x ) = 0 for .n the case of the linear function f ( x ) = m x + b , the x -intercept is given by solving the equation m x + b = 0 . In this case, we see that the x -intercept is given by ( b / m , 0 ) . In the case of a quadratic function, finding the x -intercept(s) requires finding the zeros of a quadratic equation: a x 2 + b x + c = 0 . In some cases, it is easy to factor the polynomial a x 2 + b x + c to find the zeros. If not, we make use of the quadratic formula.

Rule: the quadratic formula

Consider the quadratic equation

a x 2 + b x + c = 0 ,

where a 0 . The solutions of this equation are given by the quadratic formula

x = b ± b 2 4 a c 2 a .

If the discriminant b 2 4 a c > 0 , this formula tells us there are two real numbers that satisfy the quadratic equation. If b 2 4 a c = 0 , this formula tells us there is only one solution, and it is a real number. If b 2 4 a c < 0 , no real numbers satisfy the quadratic equation.

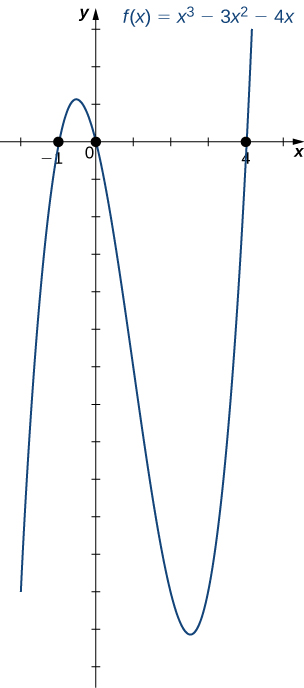
In the case of higher-degree polynomials, it may be more complicated to determine where the graph intersects the x -axis. In some instances, it is possible to find the x -intercepts by factoring the polynomial to find its zeros. In other cases, it is impossible to calculate the exact values of the x -intercepts. However, as we see later in the text, in cases such as this, we can use analytical tools to approximate (to a very high degree) where the x -intercepts are located. Here we focus on the graphs of polynomials for which we can calculate their zeros explicitly.

Graphing polynomial functions

For the following functions a. and b., i. describe the behavior of f ( x ) as x ± , ii. find all zeros of f , and iii. sketch a graph of f .

  1. f ( x ) = −2 x 2 + 4 x 1
  2. f ( x ) = x 3 3 x 2 4 x
  1. The function f ( x ) = −2 x 2 + 4 x 1 is a quadratic function.
    1. Because a = −2 < 0 , as x ± , f ( x ) −∞.
    2. To find the zeros of f , use the quadratic formula. The zeros are
      x = −4 ± 4 2 4 ( −2 ) ( −1 ) 2 ( −2 ) = −4 ± 8 −4 = −4 ± 2 2 −4 = 2 ± 2 2 .
    3. To sketch the graph of f , use the information from your previous answers and combine it with the fact that the graph is a parabola opening downward.
      An image of a graph. The x axis runs from -2 to 5 and the y axis runs from -8 to 2. The graph is of the function “f(x) = -2(x squared) + 4x - 1”, which is a parabola. The function increases until the maximum point at (1, 1) and then decreases. Both x intercept points are plotted on the function, at approximately (0.2929, 0) and (1.7071, 0). The y intercept is at the point (0, -1).
  2. The function f ( x ) = x 3 3 x 2 4 x is a cubic function.
    1. Because a = 1 > 0 , as x , f ( x ) . As x −∞ , f ( x ) −∞ .
    2. To find the zeros of f , we need to factor the polynomial. First, when we factor x out of all the terms, we find
      f ( x ) = x ( x 2 3 x 4 ) .

      Then, when we factor the quadratic function x 2 3 x 4 , we find
      f ( x ) = x ( x 4 ) ( x + 1 ) .

      Therefore, the zeros of f are x = 0 , 4 , −1 .
    3. Combining the results from parts i. and ii., draw a rough sketch of f .
      An image of a graph. The x axis runs from -2 to 5 and the y axis runs from -14 to 7. The graph is of the curved function “f(x) = (x cubed) - 3(x squared) - 4x”. The function increases until the approximate point at (-0.5, 1.1), then decreases until the approximate point (2.5, -13.1), then begins increasing again. The x intercept points are plotted on the function, at (-1, 0), (0, 0), and (4, 0). The y intercept is at the origin.
Got questions? Get instant answers now!

Get Jobilize Job Search Mobile App in your pocket Now!

Get it on Google Play Download on the App Store Now


Source:  OpenStax, Calculus volume 1. OpenStax CNX. Feb 05, 2016 Download for free at http://cnx.org/content/col11964/1.2
Google Play and the Google Play logo are trademarks of Google Inc.

Notification Switch

Would you like to follow the 'Calculus volume 1' conversation and receive update notifications?

Ask