<< Chapter < Page Chapter >> Page >
  • Calculate the slope of a linear function and interpret its meaning.
  • Recognize the degree of a polynomial.
  • Find the roots of a quadratic polynomial.
  • Describe the graphs of basic odd and even polynomial functions.
  • Identify a rational function.
  • Describe the graphs of power and root functions.
  • Explain the difference between algebraic and transcendental functions.
  • Graph a piecewise-defined function.
  • Sketch the graph of a function that has been shifted, stretched, or reflected from its initial graph position.

We have studied the general characteristics of functions, so now let’s examine some specific classes of functions. We begin by reviewing the basic properties of linear and quadratic functions, and then generalize to include higher-degree polynomials. By combining root functions with polynomials, we can define general algebraic functions and distinguish them from the transcendental functions we examine later in this chapter. We finish the section with examples of piecewise-defined functions and take a look at how to sketch the graph of a function that has been shifted, stretched, or reflected from its initial form.

Linear functions and slope

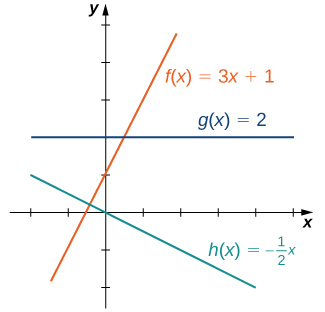
The easiest type of function to consider is a linear function    . Linear functions have the form f ( x ) = a x + b , where a and b are constants. In [link] , we see examples of linear functions when a is positive, negative, and zero. Note that if a > 0 , the graph of the line rises as x increases. In other words, f ( x ) = a x + b is increasing on (−∞, ∞) . If a < 0 , the graph of the line falls as x increases. In this case, f ( x ) = a x + b is decreasing on (−∞, ∞) . If a = 0 , the line is horizontal.

An image of a graph. The y axis runs from -2 to 5 and the x axis runs from -2 to 5. The graph is of the 3 functions. The first function is “f(x) = 3x + 1”, which is an increasing straight line with an x intercept at ((-1/3), 0) and a y intercept at (0, 1). The second function is “g(x) = 2”, which is a horizontal line with a y intercept at (0, 2) and no x intercept. The third function is “h(x) = (-1/2)x”, which is a decreasing straight line with an x intercept and y intercept both at the origin. The function f(x) is increasing at a higher rate than the function h(x) is decreasing.
These linear functions are increasing or decreasing on (∞, ∞) and one function is a horizontal line.

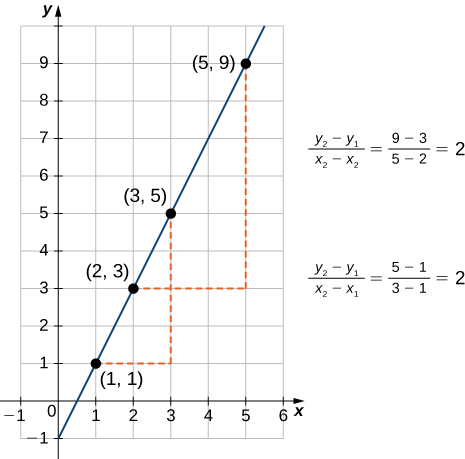
As suggested by [link] , the graph of any linear function is a line. One of the distinguishing features of a line is its slope. The slope    is the change in y for each unit change in x . The slope measures both the steepness and the direction of a line. If the slope is positive, the line points upward when moving from left to right. If the slope is negative, the line points downward when moving from left to right. If the slope is zero, the line is horizontal. To calculate the slope of a line, we need to determine the ratio of the change in y versus the change in x . To do so, we choose any two points ( x 1 , y 1 ) and ( x 2 , y 2 ) on the line and calculate y 2 y 1 x 2 x 1 . In [link] , we see this ratio is independent of the points chosen.

An image of a graph. The y axis runs from -1 to 10 and the x axis runs from -1 to 6. The graph is of a function that is an increasing straight line. There are four points labeled on the function at (1, 1), (2, 3), (3, 5), and (5, 9). There is a dotted horizontal line from the labeled function point (1, 1) to the unlabeled point (3, 1) which is not on the function, and then dotted vertical line from the unlabeled point (3, 1), which is not on the function, to the labeled function point (3, 5). These two dotted have the label “(y2 - y1)/(x2 - x1) = (5 -1)/(3 - 1) = 2”. There is a dotted horizontal line from the labeled function point (2, 3) to the unlabeled point (5, 3) which is not on the function, and then dotted vertical line from the unlabeled point (5, 3), which is not on the function, to the labeled function point (5, 9). These two dotted have the label “(y2 - y1)/(x2 - x1) = (9 -3)/(5 - 2) = 2”.
For any linear function, the slope ( y 2 y 1 ) / ( x 2 x 1 ) is independent of the choice of points ( x 1 , y 1 ) and ( x 2 , y 2 ) on the line.

Definition

Consider line L passing through points ( x 1 , y 1 ) and ( x 2 , y 2 ) . Let Δ y = y 2 y 1 and Δ x = x 2 x 1 denote the changes in y and x , respectively. The slope of the line is

m = y 2 y 1 x 2 x 1 = Δ y Δ x .

We now examine the relationship between slope and the formula for a linear function. Consider the linear function given by the formula f ( x ) = a x + b . As discussed earlier, we know the graph of a linear function is given by a line. We can use our definition of slope to calculate the slope of this line. As shown, we can determine the slope by calculating ( y 2 y 1 ) / ( x 2 x 1 ) for any points ( x 1 , y 1 ) and ( x 2 , y 2 ) on the line. Evaluating the function f at x = 0 , we see that ( 0 , b ) is a point on this line. Evaluating this function at x = 1 , we see that ( 1 , a + b ) is also a point on this line. Therefore, the slope of this line is

Questions & Answers

what is biology
Hajah Reply
the study of living organisms and their interactions with one another and their environments
AI-Robot
what is biology
Victoria Reply
HOW CAN MAN ORGAN FUNCTION
Alfred Reply
the diagram of the digestive system
Assiatu Reply
allimentary cannel
Ogenrwot
How does twins formed
William Reply
They formed in two ways first when one sperm and one egg are splited by mitosis or two sperm and two eggs join together
Oluwatobi
what is genetics
Josephine Reply
Genetics is the study of heredity
Misack
how does twins formed?
Misack
What is manual
Hassan Reply
discuss biological phenomenon and provide pieces of evidence to show that it was responsible for the formation of eukaryotic organelles
Joseph Reply
what is biology
Yousuf Reply
the study of living organisms and their interactions with one another and their environment.
Wine
discuss the biological phenomenon and provide pieces of evidence to show that it was responsible for the formation of eukaryotic organelles in an essay form
Joseph Reply
what is the blood cells
Shaker Reply
list any five characteristics of the blood cells
Shaker
lack electricity and its more savely than electronic microscope because its naturally by using of light
Abdullahi Reply
advantage of electronic microscope is easily and clearly while disadvantage is dangerous because its electronic. advantage of light microscope is savely and naturally by sun while disadvantage is not easily,means its not sharp and not clear
Abdullahi
cell theory state that every organisms composed of one or more cell,cell is the basic unit of life
Abdullahi
is like gone fail us
DENG
cells is the basic structure and functions of all living things
Ramadan
What is classification
ISCONT Reply
is organisms that are similar into groups called tara
Yamosa
in what situation (s) would be the use of a scanning electron microscope be ideal and why?
Kenna Reply
A scanning electron microscope (SEM) is ideal for situations requiring high-resolution imaging of surfaces. It is commonly used in materials science, biology, and geology to examine the topography and composition of samples at a nanoscale level. SEM is particularly useful for studying fine details,
Hilary
cell is the building block of life.
Condoleezza Reply
Got questions? Join the online conversation and get instant answers!
Jobilize.com Reply

Get Jobilize Job Search Mobile App in your pocket Now!

Get it on Google Play Download on the App Store Now


Source:  OpenStax, Calculus volume 1. OpenStax CNX. Feb 05, 2016 Download for free at http://cnx.org/content/col11964/1.2
Google Play and the Google Play logo are trademarks of Google Inc.

Notification Switch

Would you like to follow the 'Calculus volume 1' conversation and receive update notifications?

Ask