<< Chapter < Page Chapter >> Page >

When creating a table of inputs and outputs, we typically check to determine whether zero is an output. Those values of x where f ( x ) = 0 are called the zeros of a function    . For example, the zeros of f ( x ) = x 2 4 are x = ± 2 . The zeros determine where the graph of f intersects the x -axis, which gives us more information about the shape of the graph of the function. The graph of a function may never intersect the x -axis, or it may intersect multiple (or even infinitely many) times.

Another point of interest is the y -intercept, if it exists. The y -intercept is given by ( 0 , f ( 0 ) ) .

Since a function has exactly one output for each input, the graph of a function can have, at most, one y -intercept. If x = 0 is in the domain of a function f , then f has exactly one y -intercept. If x = 0 is not in the domain of f , then f has no y -intercept. Similarly, for any real number c , if c is in the domain of f , there is exactly one output f ( c ) , and the line x = c intersects the graph of f exactly once. On the other hand, if c is not in the domain of f , f ( c ) is not defined and the line x = c does not intersect the graph of f . This property is summarized in the vertical line test    .

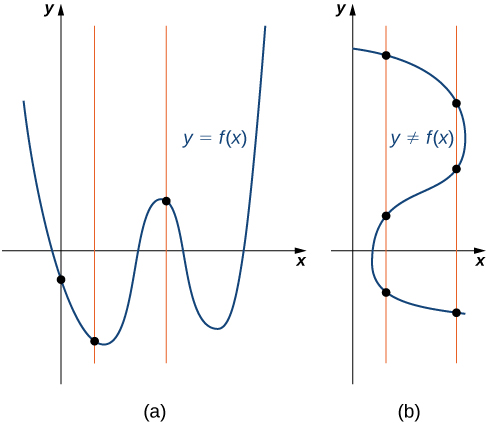
Rule: vertical line test

Given a function f , every vertical line that may be drawn intersects the graph of f no more than once. If any vertical line intersects a set of points more than once, the set of points does not represent a function.

We can use this test to determine whether a set of plotted points represents the graph of a function ( [link] ).

An image of two graphs. The first graph is labeled “a” and is of the function “y = f(x)”. Three vertical lines run through 3 points on the function, each vertical line only passing through the function once. The second graph is labeled “b” and is of the relation “y not equal to f(x)”. Two vertical lines run through the relation, one line intercepting the relation at 3 points and the other line intercepting the relation at 3 different points.
(a) The set of plotted points represents the graph of a function because every vertical line intersects the set of points, at most, once. (b) The set of plotted points does not represent the graph of a function because some vertical lines intersect the set of points more than once.

Finding zeros and y -intercepts of a function

Consider the function f ( x ) = −4 x + 2 .

  1. Find all zeros of f .
  2. Find the y -intercept (if any).
  3. Sketch a graph of f .
  1. To find the zeros, solve f ( x ) = −4 x + 2 = 0 . We discover that f has one zero at x = 1 / 2 .
  2. The y -intercept is given by ( 0 , f ( 0 ) ) = ( 0 , 2 ) .
  3. Given that f is a linear function of the form f ( x ) = m x + b that passes through the points ( 1 / 2 , 0 ) and ( 0 , 2 ) , we can sketch the graph of f ( [link] ).
    An image of a graph. The y axis runs from -2 to 5 and the x axis runs from -2 to 5. The graph is of the function “f(x) = -4x + 2”, which is a decreasing straight line. There are two points plotted on the function at (0, 2) and (1/2, 0).
    The function f ( x ) = −4 x + 2 is a line with
    x -intercept ( 1 / 2 , 0 ) and y -intercept ( 0 , 2 ) .
Got questions? Get instant answers now!

Using zeros and y -intercepts to sketch a graph

Consider the function f ( x ) = x + 3 + 1 .

  1. Find all zeros of f .
  2. Find the y -intercept (if any).
  3. Sketch a graph of f .
  1. To find the zeros, solve x + 3 + 1 = 0 . This equation implies x + 3 = −1 . Since x + 3 0 for all x , this equation has no solutions, and therefore f has no zeros.
  2. The y -intercept is given by ( 0 , f ( 0 ) ) = ( 0 , 3 + 1 ) .
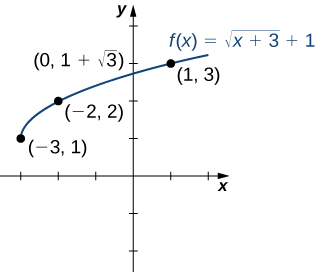
  3. To graph this function, we make a table of values. Since we need x + 3 0 , we need to choose values of x −3 . We choose values that make the square-root function easy to evaluate.
    x −3 −2 1
    f ( x ) 1 2 3

Making use of the table and knowing that, since the function is a square root, the graph of f should be similar to the graph of y = x , we sketch the graph ( [link] ).

An image of a graph. The y axis runs from -2 to 4 and the x axis runs from -3 to 2. The graph is of the function “f(x) = (square root of x + 3) + 1”, which is an increasing curved function that starts at the point (-3, 1). There are 3 points plotted on the function at (-3, 1), (-2, 2), and (1, 3). The function has a y intercept at (0, 1 + square root of 3).
The graph of f ( x ) = x + 3 + 1 has a
y -intercept but no x -intercepts.
Got questions? Get instant answers now!

Find the zeros of f ( x ) = x 3 5 x 2 + 6 x .

x = 0 , 2 , 3

Got questions? Get instant answers now!

Finding the height of a free-falling object

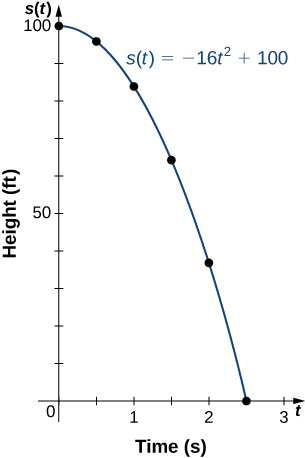
If a ball is dropped from a height of 100 ft, its height s at time t is given by the function s ( t ) = −16 t 2 + 100 , where s is measured in feet and t is measured in seconds. The domain is restricted to the interval [ 0 , c ] , where t = 0 is the time when the ball is dropped and t = c is the time when the ball hits the ground.

  1. Create a table showing the height s ( t ) when t = 0 , 0.5 , 1 , 1.5 , 2 , and 2.5 . Using the data from the table, determine the domain for this function. That is, find the time c when the ball hits the ground.
  2. Sketch a graph of s .

  1. Height s As a function of time t
    t 0 0.5 1 1.5 2 2.5
    s ( t ) 100 96 84 64 36 0

    Since the ball hits the ground when t = 2.5 , the domain of this function is the interval [ 0 , 2.5 ] .


  2. An image of a graph. The y axis runs from 0 to 100 and is labeled “s(t), height in feet”. The x axis runs from 0 to 3 and is labeled “t, time in seconds”. The graph is of the function “s(t) = -16 t squared + 100”, which is a decreasing curved function that starts at the y intercept point (0, 100). There are 6 points plotted on the function at (0, 100), (0.5, 96), (1, 84), (1.5, 64), (2, 36), and (2.5, 0). The function has a x intercept at the last point (2.5, 0).
Got questions? Get instant answers now!

Questions & Answers

what is biology
Hajah Reply
the study of living organisms and their interactions with one another and their environments
AI-Robot
what is biology
Victoria Reply
HOW CAN MAN ORGAN FUNCTION
Alfred Reply
the diagram of the digestive system
Assiatu Reply
allimentary cannel
Ogenrwot
How does twins formed
William Reply
They formed in two ways first when one sperm and one egg are splited by mitosis or two sperm and two eggs join together
Oluwatobi
what is genetics
Josephine Reply
Genetics is the study of heredity
Misack
how does twins formed?
Misack
What is manual
Hassan Reply
discuss biological phenomenon and provide pieces of evidence to show that it was responsible for the formation of eukaryotic organelles
Joseph Reply
what is biology
Yousuf Reply
the study of living organisms and their interactions with one another and their environment.
Wine
discuss the biological phenomenon and provide pieces of evidence to show that it was responsible for the formation of eukaryotic organelles in an essay form
Joseph Reply
what is the blood cells
Shaker Reply
list any five characteristics of the blood cells
Shaker
lack electricity and its more savely than electronic microscope because its naturally by using of light
Abdullahi Reply
advantage of electronic microscope is easily and clearly while disadvantage is dangerous because its electronic. advantage of light microscope is savely and naturally by sun while disadvantage is not easily,means its not sharp and not clear
Abdullahi
cell theory state that every organisms composed of one or more cell,cell is the basic unit of life
Abdullahi
is like gone fail us
DENG
cells is the basic structure and functions of all living things
Ramadan
What is classification
ISCONT Reply
is organisms that are similar into groups called tara
Yamosa
in what situation (s) would be the use of a scanning electron microscope be ideal and why?
Kenna Reply
A scanning electron microscope (SEM) is ideal for situations requiring high-resolution imaging of surfaces. It is commonly used in materials science, biology, and geology to examine the topography and composition of samples at a nanoscale level. SEM is particularly useful for studying fine details,
Hilary
cell is the building block of life.
Condoleezza Reply
Got questions? Join the online conversation and get instant answers!
Jobilize.com Reply

Get Jobilize Job Search Mobile App in your pocket Now!

Get it on Google Play Download on the App Store Now


Source:  OpenStax, Calculus volume 1. OpenStax CNX. Feb 05, 2016 Download for free at http://cnx.org/content/col11964/1.2
Google Play and the Google Play logo are trademarks of Google Inc.

Notification Switch

Would you like to follow the 'Calculus volume 1' conversation and receive update notifications?

Ask