

| << Chapter < Page | Chapter >> Page > |
Visit this applet link to see more about graphs of functions.
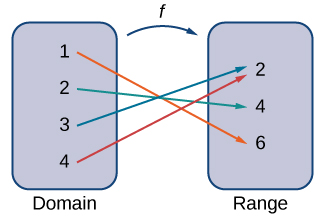
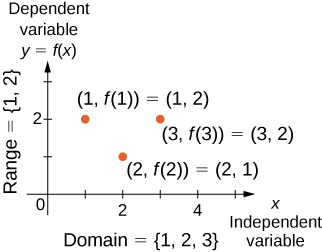
We can also visualize a function by plotting points in the coordinate plane where The graph of a function is the set of all these points. For example, consider the function where the domain is the set and the rule is In [link] , we plot a graph of this function.

Every function has a domain. However, sometimes a function is described by an equation, as in with no specific domain given. In this case, the domain is taken to be the set of all real numbers for which is a real number. For example, since any real number can be squared, if no other domain is specified, we consider the domain of to be the set of all real numbers. On the other hand, the square root function only gives a real output if is nonnegative. Therefore, the domain of the function is the set of nonnegative real numbers, sometimes called the natural domain .
For the functions and the domains are sets with an infinite number of elements. Clearly we cannot list all these elements. When describing a set with an infinite number of elements, it is often helpful to use set-builder or interval notation. When using set-builder notation to describe a subset of all real numbers, denoted we write
We read this as the set of real numbers such that has some property. For example, if we were interested in the set of real numbers that are greater than one but less than five, we could denote this set using set-builder notation by writing
A set such as this, which contains all numbers greater than and less than can also be denoted using the interval notation Therefore,
The numbers and are called the endpoints of this set. If we want to consider the set that includes the endpoints, we would denote this set by writing
We can use similar notation if we want to include one of the endpoints, but not the other. To denote the set of nonnegative real numbers, we would use the set-builder notation
The smallest number in this set is zero, but this set does not have a largest number. Using interval notation, we would use the symbol which refers to positive infinity, and we would write the set as
It is important to note that is not a real number. It is used symbolically here to indicate that this set includes all real numbers greater than or equal to zero. Similarly, if we wanted to describe the set of all nonpositive numbers, we could write
Notification Switch
Would you like to follow the 'Calculus volume 1' conversation and receive update notifications?

|
|

|
|

|
|

|
|

|
|

|
|

|
|

|
|

|
|

|