| << Chapter < Page | Chapter >> Page > |

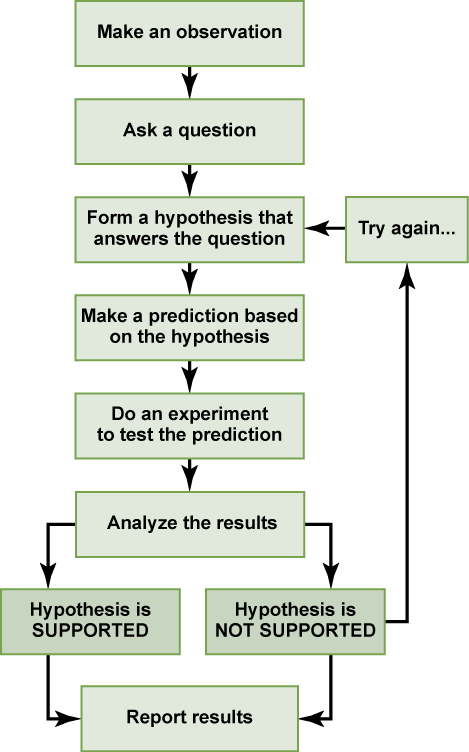
In practice, the scientific method is not as rigid and structured as it might at first appear. Sometimes an experiment leads to conclusions that favor a change in approach; often, an experiment brings entirely new scientific questions to the puzzle. Many times, science does not operate in a linear fashion; instead, scientists continually draw inferences and make generalizations, finding patterns as their research proceeds. Scientific reasoning is more complex than the scientific method alone suggests.
Whether scientific research is basic science or applied science, scientists must share their findings for other researchers to expand and build upon their discoveries. Communication and collaboration within and between sub disciplines of science are key to the advancement of knowledge in science. For this reason, an important aspect of a scientist’s work is disseminating results and communicating with peers. Scientists can share results by presenting them at a scientific meeting or conference, but this approach can reach only the limited few who are present. Instead, most scientists present their results in peer-reviewed articles that are published in scientific journals. Peer-reviewed articles are scientific papers that are reviewed, usually anonymously by a scientist’s colleagues, or peers. These colleagues are qualified individuals, often experts in the same research area, who judge whether or not the scientist’s work is suitable for publication. The process of peer review helps to ensure that the research described in a scientific paper or grant proposal is original, significant, logical, and thorough. Grant proposals, which are requests for research funding, are also subject to peer review. Scientists publish their work so other scientists can reproduce their experiments under similar or different conditions to expand on the findings. The experimental results must be consistent with the findings of other scientists.
There are many journals and the popular press that do not use a peer-review system. A large number of online open-access journals, journals with articles available without cost, are now available many of which use rigorous peer-review systems, but some of which do not. Results of any studies published in these forums without peer review are not reliable and should not form the basis for other scientific work. In one exception, journals may allow a researcher to cite a personal communication from another researcher about unpublished results with the cited author’s permission.
A hypothesis is a tentative explanation for an observation. A scientific theory is a well-tested and consistently verified explanation for a set of observations or phenomena. A scientific law is a description, often in the form of a mathematical formula, of the behavior of an aspect of nature under certain circumstances. The common thread throughout scientific research is the use of the scientific method. Scientists present their results in peer-reviewed scientific papers published in scientific journals.
[link] In the example below, the scientific method is used to solve an everyday problem. Which part in the example below is the hypothesis? Which is the prediction? Based on the results of the experiment, is the hypothesis supported? If it is not supported, propose some alternative hypotheses.
[link] The hypothesis is #3 (there is something wrong with the electrical outlet), and the prediction is #4 (if something is wrong with the outlet, then the coffeemaker also won’t work when plugged into the outlet). The original hypothesis is not supported, as the coffee maker works when plugged into the outlet. Alternative hypotheses may include (1) the toaster might be broken or (2) the toaster wasn’t turned on.

Notification Switch
Would you like to follow the 'Human biology' conversation and receive update notifications?