<< Chapter < Page Chapter >> Page >
By the end of this section, you will be able to:
  • Describe the definition of species and how species are identified as different
  • Explain allopatric and sympatric speciation
  • Describe adaptive radiation

The biological definition of species, which works for sexually reproducing organisms, is a group of actually or potentially interbreeding individuals. According to this definition, one species is distinguished from another by the possibility of matings between individuals from each species to produce fertile offspring. There are exceptions to this rule. Many species are similar enough that hybrid offspring are possible and may often occur in nature, but for the majority of species this rule generally holds. In fact, the presence of hybrids between similar species suggests that they may have descended from a single interbreeding species and that the speciation process may not yet be completed.

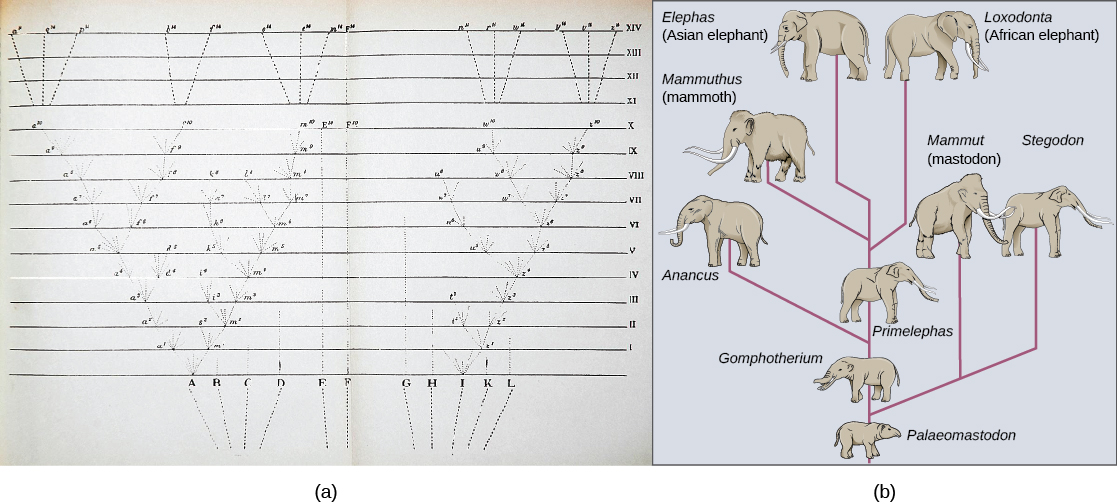
Given the extraordinary diversity of life on the planet there must be mechanisms for speciation    : the formation of two species from one original species. Darwin envisioned this process as a branching event and diagrammed the process in the only illustration found in On the Origin of Species ( [link] a ). For speciation to occur, two new populations must be formed from one original population, and they must evolve in such a way that it becomes impossible for individuals from the two new populations to interbreed. Biologists have proposed mechanisms by which this could occur that fall into two broad categories. Allopatric speciation , meaning speciation in “other homelands,” involves a geographic separation of populations from a parent species and subsequent evolution. Sympatric speciation , meaning speciation in the “same homeland,” involves speciation occurring within a parent species while remaining in one location.

Biologists think of speciation events as the splitting of one ancestral species into two descendant species. There is no reason why there might not be more than two species formed at one time except that it is less likely and such multiple events can also be conceptualized as single splits occurring close in time.

Photo (a) shows a yellowed piece of paper with evenly spaced horizontal lines numbered from 0 at the bottom to 14 at the top. Below the horizontal lines are vertical lines labeled A to L from left to right. From these originating vertical lines other vertical lines extend upward to as far as the horizontal line number 10, some ending at a lower level. The lines at letter A and I have many branches, resembling a tree. The lines that reach level 10 are further extended with 1 to 3 vertical lines in level 11 to 14. Illustration (b) shows the evolution of modern African and Asian elephants from a common ancestor, the Palaeomastodon. The Palaeomastodon was similar to modern elephants; however, it was smaller and had a long nose instead of a trunk. Side branches of the elephant evolutionary tree gave rise to mastodons and mammoths. The mammoth is more closely related to modern elephants than mastodons.
The only illustration in Darwin’s On the Origin of Species is (a) a diagram showing speciation events leading to biological diversity. The diagram shows similarities to phylogenetic charts that are drawn today to illustrate the relationships of species. (b) Modern elephants evolved from the Palaeomastodon , a species that lived in Egypt 35–50 million years ago.

Speciation through geographic separation

A geographically continuous population has a gene pool that is relatively homogeneous. Gene flow, the movement of alleles across the range of the species, is relatively free because individuals can move and then mate with individuals in their new location. Thus, the frequency of an allele at one end of a distribution will be similar to the frequency of the allele at the other end. When populations become geographically discontinuous that free-flow of alleles is prevented. When that separation lasts for a period of time, the two populations are able to evolve along different trajectories. Thus, their allele frequencies at numerous genetic loci gradually become more and more different as new alleles independently arise by mutation in each population. Typically, environmental conditions, such as climate, resources, predators, and competitors, for the two populations will differ causing natural selection to favor divergent adaptations in each group. Different histories of genetic drift, enhanced because the populations are smaller than the parent population, will also lead to divergence.

Questions & Answers

differentiate between demand and supply giving examples
Lambiv Reply
differentiated between demand and supply using examples
Lambiv
what is labour ?
Lambiv
how will I do?
Venny Reply
how is the graph works?I don't fully understand
Rezat Reply
information
Eliyee
devaluation
Eliyee
t
WARKISA
hi guys good evening to all
Lambiv
multiple choice question
Aster Reply
appreciation
Eliyee
explain perfect market
Lindiwe Reply
In economics, a perfect market refers to a theoretical construct where all participants have perfect information, goods are homogenous, there are no barriers to entry or exit, and prices are determined solely by supply and demand. It's an idealized model used for analysis,
Ezea
What is ceteris paribus?
Shukri Reply
other things being equal
AI-Robot
When MP₁ becomes negative, TP start to decline. Extuples Suppose that the short-run production function of certain cut-flower firm is given by: Q=4KL-0.6K2 - 0.112 • Where is quantity of cut flower produced, I is labour input and K is fixed capital input (K-5). Determine the average product of lab
Kelo
Extuples Suppose that the short-run production function of certain cut-flower firm is given by: Q=4KL-0.6K2 - 0.112 • Where is quantity of cut flower produced, I is labour input and K is fixed capital input (K-5). Determine the average product of labour (APL) and marginal product of labour (MPL)
Kelo
yes,thank you
Shukri
Can I ask you other question?
Shukri
what is monopoly mean?
Habtamu Reply
What is different between quantity demand and demand?
Shukri Reply
Quantity demanded refers to the specific amount of a good or service that consumers are willing and able to purchase at a give price and within a specific time period. Demand, on the other hand, is a broader concept that encompasses the entire relationship between price and quantity demanded
Ezea
ok
Shukri
how do you save a country economic situation when it's falling apart
Lilia Reply
what is the difference between economic growth and development
Fiker Reply
Economic growth as an increase in the production and consumption of goods and services within an economy.but Economic development as a broader concept that encompasses not only economic growth but also social & human well being.
Shukri
production function means
Jabir
What do you think is more important to focus on when considering inequality ?
Abdisa Reply
any question about economics?
Awais Reply
sir...I just want to ask one question... Define the term contract curve? if you are free please help me to find this answer 🙏
Asui
it is a curve that we get after connecting the pareto optimal combinations of two consumers after their mutually beneficial trade offs
Awais
thank you so much 👍 sir
Asui
In economics, the contract curve refers to the set of points in an Edgeworth box diagram where both parties involved in a trade cannot be made better off without making one of them worse off. It represents the Pareto efficient allocations of goods between two individuals or entities, where neither p
Cornelius
In economics, the contract curve refers to the set of points in an Edgeworth box diagram where both parties involved in a trade cannot be made better off without making one of them worse off. It represents the Pareto efficient allocations of goods between two individuals or entities,
Cornelius
Suppose a consumer consuming two commodities X and Y has The following utility function u=X0.4 Y0.6. If the price of the X and Y are 2 and 3 respectively and income Constraint is birr 50. A,Calculate quantities of x and y which maximize utility. B,Calculate value of Lagrange multiplier. C,Calculate quantities of X and Y consumed with a given price. D,alculate optimum level of output .
Feyisa Reply
Answer
Feyisa
c
Jabir
the market for lemon has 10 potential consumers, each having an individual demand curve p=101-10Qi, where p is price in dollar's per cup and Qi is the number of cups demanded per week by the i th consumer.Find the market demand curve using algebra. Draw an individual demand curve and the market dema
Gsbwnw Reply
suppose the production function is given by ( L, K)=L¼K¾.assuming capital is fixed find APL and MPL. consider the following short run production function:Q=6L²-0.4L³ a) find the value of L that maximizes output b)find the value of L that maximizes marginal product
Abdureman
types of unemployment
Yomi Reply
What is the difference between perfect competition and monopolistic competition?
Mohammed
Got questions? Join the online conversation and get instant answers!
Jobilize.com Reply

Get Jobilize Job Search Mobile App in your pocket Now!

Get it on Google Play Download on the App Store Now


Source:  OpenStax, Concepts of biology. OpenStax CNX. Feb 29, 2016 Download for free at http://cnx.org/content/col11487/1.9
Google Play and the Google Play logo are trademarks of Google Inc.

Notification Switch

Would you like to follow the 'Concepts of biology' conversation and receive update notifications?

Ask