<< Chapter < Page Chapter >> Page >

Imagine a population of ten individuals, half with allele A and half with allele a (the individuals are haploid). In a stable population, the next generation will also have ten individuals. Choose that generation randomly by flipping a coin ten times and let heads be A and tails be a . It is unlikely that the next generation will have exactly half of each allele. There might be six of one and four of the other, or some different set of frequencies. Thus, the allele frequencies have changed and evolution has occurred. A coin will no longer work to choose the next generation (because the odds are no longer one half for each allele). The frequency in each generation will drift up and down on what is known as a random walk until at one point either all A or all a are chosen and that allele is fixed from that point on. This could take a very long time for a large population. This simplification is not very biological, but it can be shown that real populations behave this way. The effect of drift on frequencies is greater the smaller a population is. Its effect is also greater on an allele with a frequency far from one half. Drift will influence every allele, even those that are being naturally selected.
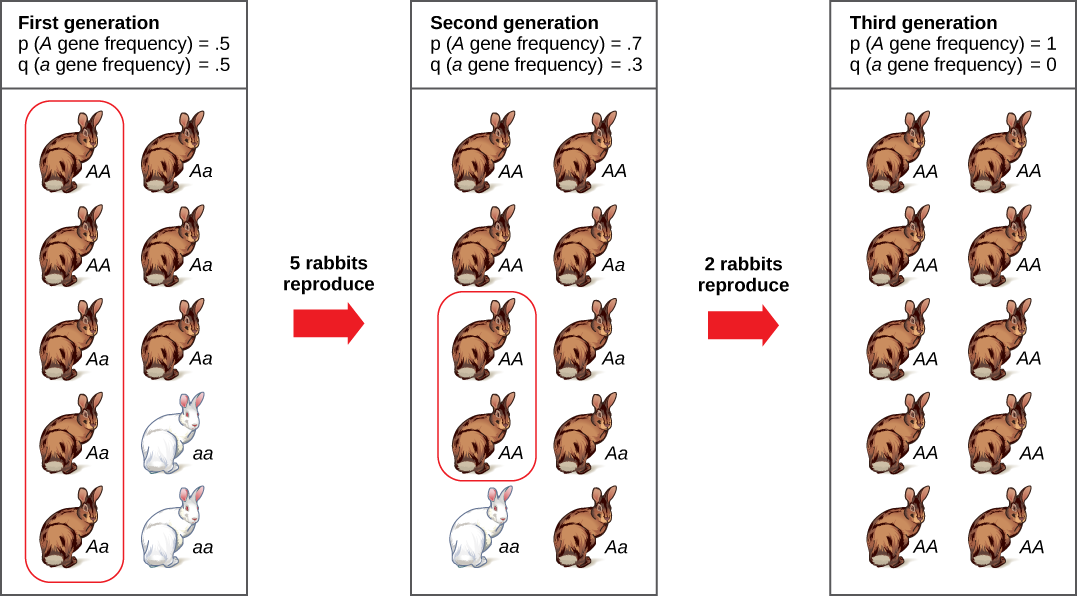
Art connection

A population has ten rabbits. Three of these rabbits are homozygous dominant for the A allele and have brown coat color. Five are heterozygous and also have brown coat color. Two are homozygous recessive and have white coat color. The frequency of the capital A allele, p, is .5 and the frequency of the small a allele, q, is also .5. Only five of the rabbits, including two homozygous dominant and three heterozygous individuals, produce offspring. Five of the resulting offspring are homozygous dominant, four are heterozygous, and one is homozygous recessive. The frequency of alleles in the second generation is p=.7 and q=.3. Only two rabbits in the second generation produce offspring, and both of these are homozygous dominant. As a result, the recessive small a allele is lost in the third generation, and all of the rabbits are heterozygous dominant with brown coat color.
Genetic drift in a population can lead to the elimination of an allele from a population by chance. In each generation, a random set of individuals reproduces to produce the next generation. The frequency of alleles in the next generation is equal to the frequency of alleles among the individuals reproducing.

Do you think genetic drift would happen more quickly on an island or on the mainland?

Genetic drift can also be magnified by natural or human-caused events, such as a disaster that randomly kills a large portion of the population, which is known as the bottleneck effect    that results in a large portion of the genome suddenly being wiped out ( [link] ). In one fell swoop, the genetic structure of the survivors becomes the genetic structure of the entire population, which may be very different from the pre-disaster population. The disaster must be one that kills for reasons unrelated to the organism’s traits, such as a hurricane or lava flow. A mass killing caused by unusually cold temperatures at night, is likely to affect individuals differently depending on the alleles they possess that confer cold hardiness.
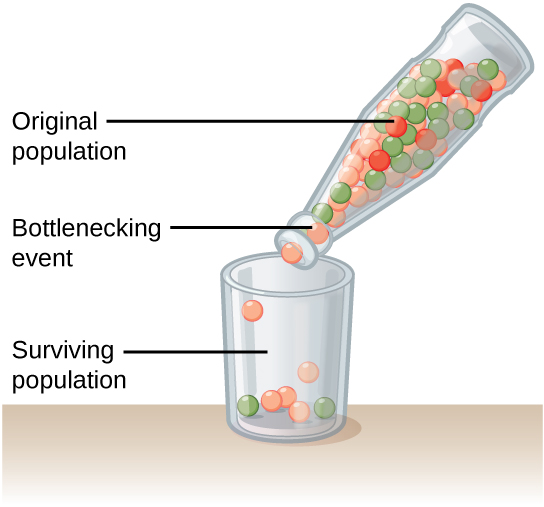
Illustration shows a narrow-neck bottle filled with red, orange, and green marbles tipped so the marbles pour into a glass. Because of the bottleneck, only seven marbles escape, and these are all orange and green. The marbles in the bottle represent the original population, and the marbles in the glass represent the surviving population. Because of the bottleneck effect, the surviving population is less diverse than the original population.
A chance event or catastrophe can reduce the genetic variability within a population.

Another scenario in which populations might experience a strong influence of genetic drift is if some portion of the population leaves to start a new population in a new location, or if a population gets divided by a physical barrier of some kind. In this situation, those individuals are unlikely to be representative of the entire population which results in the founder effect    . The founder effect occurs when the genetic structure matches that of the new population’s founding fathers and mothers. The founder effect is believed to have been a key factor in the genetic history of the Afrikaner population of Dutch settlers in South Africa, as evidenced by mutations that are common in Afrikaners but rare in most other populations. This is likely due to a higher-than-normal proportion of the founding colonists, which were a small sample of the original population, carried these mutations. As a result, the population expresses unusually high incidences of Huntington’s disease (HD) and Fanconi anemia (FA), a genetic disorder known to cause bone marrow and congenital abnormalities, and even cancer. A. J. Tipping et al., “Molecular and Genealogical Evidence for a Founder Effect in Fanconi Anemia Families of the Afrikaner Population of South Africa,” PNAS 98, no. 10 (2001): 5734-5739, doi: 10.1073/pnas.091402398.

Concept in action

Visit this site to learn more about genetic drift and to run simulations of allele changes caused by drift.

Gene flow

Another important evolutionary force is gene flow    , or the flow of alleles in and out of a population resulting from the migration of individuals or gametes ( [link] ). While some populations are fairly stable, others experience more flux. Many plants, for example, send their seeds far and wide, by wind or in the guts of animals; these seeds may introduce alleles common in the source population to a new population in which they are rare.
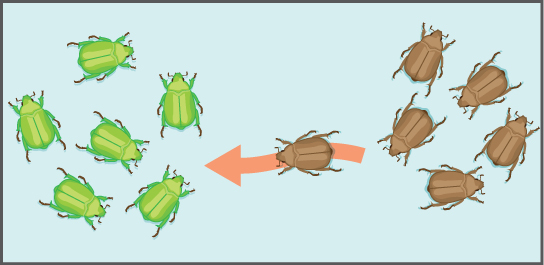
Illustration shows an individual from a population of brown beetles traveling toward a population of green beetles.
Gene flow can occur when an individual travels from one geographic location to another and joins a different population of the species. In the example shown here, the brown allele is introduced into the green population.

Section summary

There are four factors that can change the allele frequencies of a population. Natural selection works by selecting for alleles that confer beneficial traits or behaviors, while selecting against those for deleterious qualities. Mutations introduce new alleles into a population. Genetic drift stems from the chance occurrence that some individuals have more offspring than others and results in changes in allele frequencies that are random in direction. When individuals leave or join the population, allele frequencies can change as a result of gene flow.

Art connections

[link] Do you think genetic drift would happen more quickly on an island or on the mainland?

[link] Genetic drift is likely to occur more rapidly on an island, where smaller populations are expected to occur.

Got questions? Get instant answers now!

Questions & Answers

What are the factors that affect demand for a commodity
Florence Reply
differentiate between demand and supply giving examples
Lambiv Reply
differentiated between demand and supply using examples
Lambiv
what is labour ?
Lambiv
how will I do?
Venny Reply
how is the graph works?I don't fully understand
Rezat Reply
information
Eliyee
devaluation
Eliyee
t
WARKISA
hi guys good evening to all
Lambiv
multiple choice question
Aster Reply
appreciation
Eliyee
explain perfect market
Lindiwe Reply
In economics, a perfect market refers to a theoretical construct where all participants have perfect information, goods are homogenous, there are no barriers to entry or exit, and prices are determined solely by supply and demand. It's an idealized model used for analysis,
Ezea
What is ceteris paribus?
Shukri Reply
other things being equal
AI-Robot
When MP₁ becomes negative, TP start to decline. Extuples Suppose that the short-run production function of certain cut-flower firm is given by: Q=4KL-0.6K2 - 0.112 • Where is quantity of cut flower produced, I is labour input and K is fixed capital input (K-5). Determine the average product of lab
Kelo
Extuples Suppose that the short-run production function of certain cut-flower firm is given by: Q=4KL-0.6K2 - 0.112 • Where is quantity of cut flower produced, I is labour input and K is fixed capital input (K-5). Determine the average product of labour (APL) and marginal product of labour (MPL)
Kelo
yes,thank you
Shukri
Can I ask you other question?
Shukri
what is monopoly mean?
Habtamu Reply
What is different between quantity demand and demand?
Shukri Reply
Quantity demanded refers to the specific amount of a good or service that consumers are willing and able to purchase at a give price and within a specific time period. Demand, on the other hand, is a broader concept that encompasses the entire relationship between price and quantity demanded
Ezea
ok
Shukri
how do you save a country economic situation when it's falling apart
Lilia Reply
what is the difference between economic growth and development
Fiker Reply
Economic growth as an increase in the production and consumption of goods and services within an economy.but Economic development as a broader concept that encompasses not only economic growth but also social & human well being.
Shukri
production function means
Jabir
What do you think is more important to focus on when considering inequality ?
Abdisa Reply
any question about economics?
Awais Reply
sir...I just want to ask one question... Define the term contract curve? if you are free please help me to find this answer 🙏
Asui
it is a curve that we get after connecting the pareto optimal combinations of two consumers after their mutually beneficial trade offs
Awais
thank you so much 👍 sir
Asui
In economics, the contract curve refers to the set of points in an Edgeworth box diagram where both parties involved in a trade cannot be made better off without making one of them worse off. It represents the Pareto efficient allocations of goods between two individuals or entities, where neither p
Cornelius
In economics, the contract curve refers to the set of points in an Edgeworth box diagram where both parties involved in a trade cannot be made better off without making one of them worse off. It represents the Pareto efficient allocations of goods between two individuals or entities,
Cornelius
Suppose a consumer consuming two commodities X and Y has The following utility function u=X0.4 Y0.6. If the price of the X and Y are 2 and 3 respectively and income Constraint is birr 50. A,Calculate quantities of x and y which maximize utility. B,Calculate value of Lagrange multiplier. C,Calculate quantities of X and Y consumed with a given price. D,alculate optimum level of output .
Feyisa Reply
Answer
Feyisa
c
Jabir
the market for lemon has 10 potential consumers, each having an individual demand curve p=101-10Qi, where p is price in dollar's per cup and Qi is the number of cups demanded per week by the i th consumer.Find the market demand curve using algebra. Draw an individual demand curve and the market dema
Gsbwnw Reply
suppose the production function is given by ( L, K)=L¼K¾.assuming capital is fixed find APL and MPL. consider the following short run production function:Q=6L²-0.4L³ a) find the value of L that maximizes output b)find the value of L that maximizes marginal product
Abdureman
Got questions? Join the online conversation and get instant answers!
Jobilize.com Reply

Get Jobilize Job Search Mobile App in your pocket Now!

Get it on Google Play Download on the App Store Now


Source:  OpenStax, Concepts of biology. OpenStax CNX. Feb 29, 2016 Download for free at http://cnx.org/content/col11487/1.9
Google Play and the Google Play logo are trademarks of Google Inc.

Notification Switch

Would you like to follow the 'Concepts of biology' conversation and receive update notifications?

Ask