

| << Chapter < Page | Chapter >> Page > |
Mendel performed hybridizations , which involve mating two true-breeding individuals that have different traits. In the pea, which is naturally self-pollinating, this is done by manually transferring pollen from the anther of a mature pea plant of one variety to the stigma of a separate mature pea plant of the second variety.
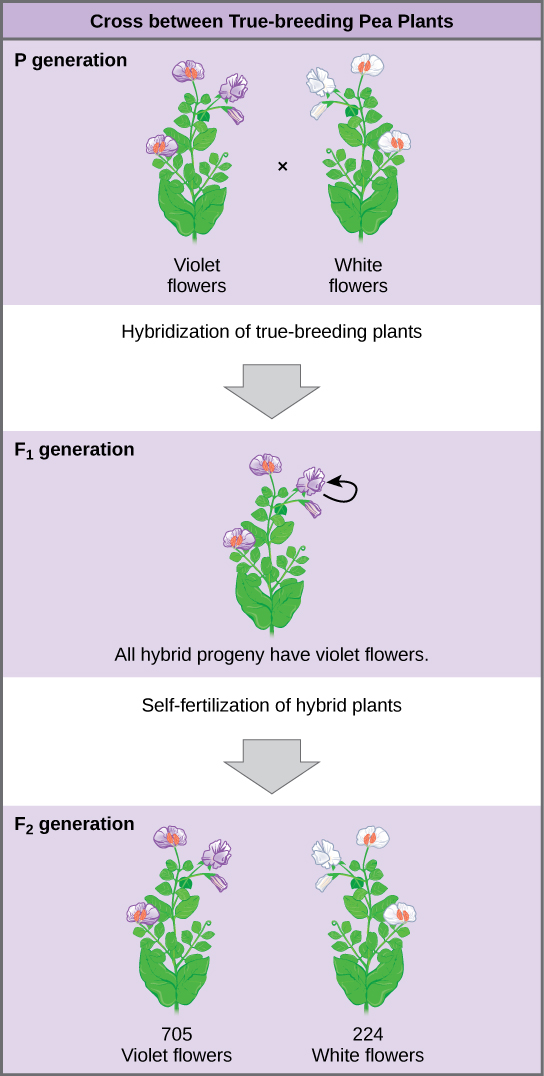
Plants used in first-generation crosses were called P , or parental generation, plants ( [link] ). Mendel collected the seeds produced by the P plants that resulted from each cross and grew them the following season. These offspring were called the F 1 , or the first filial (filial = daughter or son), generation. Once Mendel examined the characteristics in the F 1 generation of plants, he allowed them to self-fertilize naturally. He then collected and grew the seeds from the F 1 plants to produce the F 2 , or second filial, generation. Mendel’s experiments extended beyond the F 2 generation to the F 3 generation, F 4 generation, and so on, but it was the ratio of characteristics in the P, F 1 , and F 2 generations that were the most intriguing and became the basis of Mendel’s postulates.
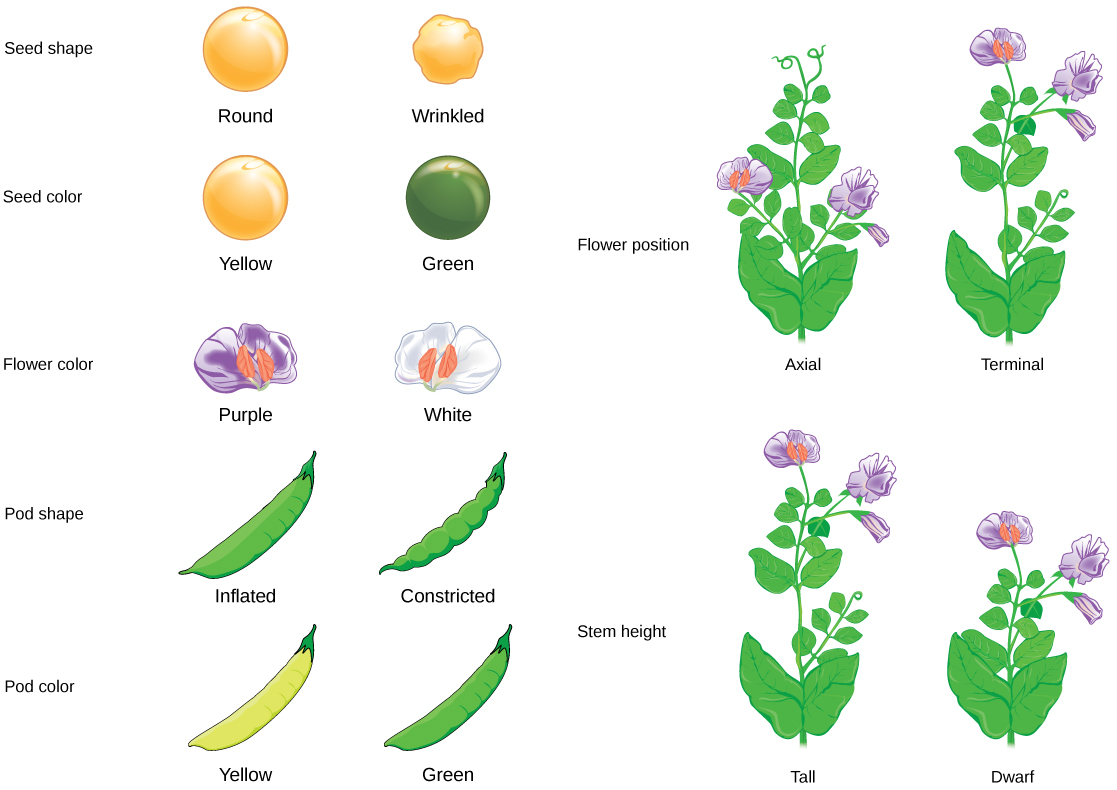
In his 1865 publication, Mendel reported the results of his crosses involving seven different characteristics, each with two contrasting traits. A trait is defined as a variation in the physical appearance of a heritable characteristic. The characteristics included plant height, seed texture, seed color, flower color, pea-pod size, pea-pod color, and flower position. For the characteristic of flower color, for example, the two contrasting traits were white versus violet. To fully examine each characteristic, Mendel generated large numbers of F 1 and F 2 plants and reported results from thousands of F 2 plants.
What results did Mendel find in his crosses for flower color? First, Mendel confirmed that he was using plants that bred true for white or violet flower color. Irrespective of the number of generations that Mendel examined, all self-crossed offspring of parents with white flowers had white flowers, and all self-crossed offspring of parents with violet flowers had violet flowers. In addition, Mendel confirmed that, other than flower color, the pea plants were physically identical. This was an important check to make sure that the two varieties of pea plants only differed with respect to one trait, flower color.
Once these validations were complete, Mendel applied the pollen from a plant with violet flowers to the stigma of a plant with white flowers. After gathering and sowing the seeds that resulted from this cross, Mendel found that 100 percent of the F 1 hybrid generation had violet flowers. Conventional wisdom at that time would have predicted the hybrid flowers to be pale violet or for hybrid plants to have equal numbers of white and violet flowers. In other words, the contrasting parental traits were expected to blend in the offspring. Instead, Mendel’s results demonstrated that the white flower trait had completely disappeared in the F 1 generation.
Importantly, Mendel did not stop his experimentation there. He allowed the F 1 plants to self-fertilize and found that 705 plants in the F 2 generation had violet flowers and 224 had white flowers. This was a ratio of 3.15 violet flowers to one white flower, or approximately 3:1. When Mendel transferred pollen from a plant with violet flowers to the stigma of a plant with white flowers and vice versa, he obtained approximately the same ratio irrespective of which parent—male or female—contributed which trait. This is called a reciprocal cross —a paired cross in which the respective traits of the male and female in one cross become the respective traits of the female and male in the other cross. For the other six characteristics that Mendel examined, the F 1 and F 2 generations behaved in the same way that they behaved for flower color. One of the two traits would disappear completely from the F 1 generation, only to reappear in the F 2 generation at a ratio of roughly 3:1 ( [link] ).
Upon compiling his results for many thousands of plants, Mendel concluded that the characteristics could be divided into expressed and latent traits. He called these dominant and recessive traits, respectively. Dominant traits are those that are inherited unchanged in a hybridization. Recessive traits become latent, or disappear in the offspring of a hybridization. The recessive trait does, however, reappear in the progeny of the hybrid offspring. An example of a dominant trait is the violet-colored flower trait. For this same characteristic (flower color), white-colored flowers are a recessive trait. The fact that the recessive trait reappeared in the F 2 generation meant that the traits remained separate (and were not blended) in the plants of the F 1 generation. Mendel proposed that this was because the plants possessed two copies of the trait for the flower-color characteristic, and that each parent transmitted one of their two copies to their offspring, where they came together. Moreover, the physical observation of a dominant trait could mean that the genetic composition of the organism included two dominant versions of the characteristic, or that it included one dominant and one recessive version. Conversely, the observation of a recessive trait meant that the organism lacked any dominant versions of this characteristic.
For an excellent review of Mendel’s experiments and to perform your own crosses and identify patterns of inheritance, visit the Mendel’s Peas web lab.
Working with garden pea plants, Mendel found that crosses between parents that differed for one trait produced F 1 offspring that all expressed one parent’s traits. The traits that were visible in the F 1 generation are referred to as dominant, and traits that disappear in the F 1 generation are described as recessive. When the F 1 plants in Mendel’s experiment were self-crossed, the F 2 offspring exhibited the dominant trait or the recessive trait in a 3:1 ratio, confirming that the recessive trait had been transmitted faithfully from the original P parent. Reciprocal crosses generated identical F 1 and F 2 offspring ratios. By examining sample sizes, Mendel showed that traits were inherited as independent events.
Notification Switch
Would you like to follow the 'Concepts of biology' conversation and receive update notifications?

|
|
|
|
|

|
|

|
|

|
|

|
|

|
|

|
|

|
|

|
|

|
|

|