<< Chapter < Page Chapter >> Page >

Evolution in action

Why did the woolly mammoth go extinct?

 Image (a) shows a painting of mammoths walking in the snow. Photo (b) shows a stuffed mammoth sitting in a museum display case. Photo (c) shows a mummified baby mammoth, also in a display case.
The three images include: (a) 1916 mural of a mammoth herd from the American Museum of Natural History, (b) the only stuffed mammoth in the world is in the Museum of Zoology located in St. Petersburg, Russia, and (c) a one-month-old baby mammoth, named Lyuba, discovered in Siberia in 2007. (credit a: modification of work by Charles R. Knight; credit b: modification of work by “Tanapon”/Flickr; credit c: modification of work by Matt Howry)

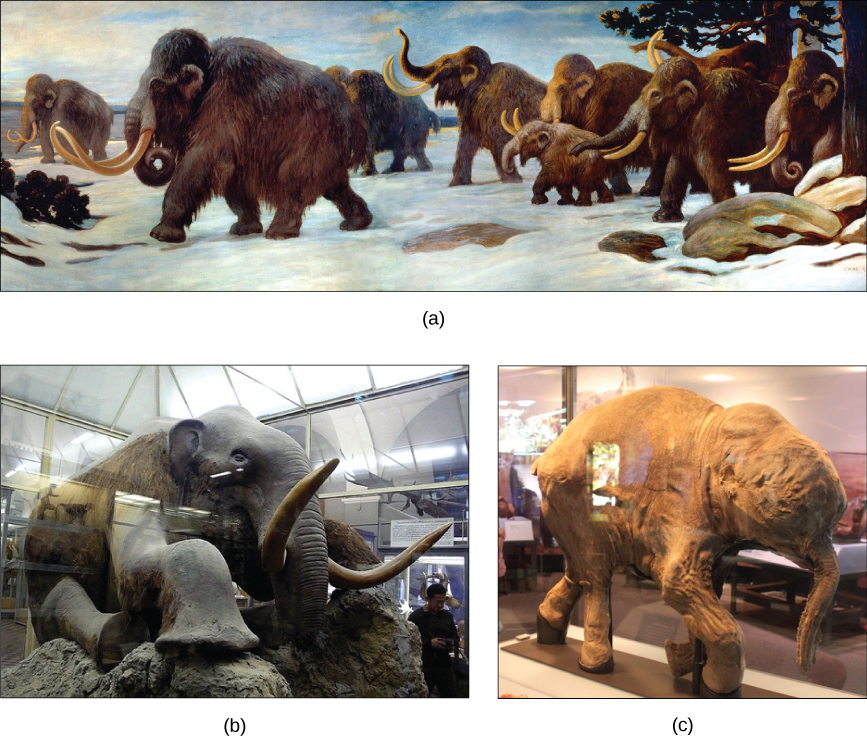
Woolly mammoths began to go extinct about 10,000 years ago, soon after paleontologists believe humans able to hunt them began to colonize North America and northern Eurasia ( [link] ). A mammoth population survived on Wrangel Island, in the East Siberian Sea, and was isolated from human contact until as recently as 1700 BC. We know a lot about these animals from carcasses found frozen in the ice of Siberia and other northern regions.

It is commonly thought that climate change and human hunting led to their extinction. A 2008 study estimated that climate change reduced the mammoth’s range from 3,000,000 square miles 42,000 years ago to 310,000 square miles 6,000 years ago. David Nogués-Bravo et al., “Climate Change, Humans, and the Extinction of the Woolly Mammoth.” PLoS Biol 6 (April 2008): e79, doi:10.1371/journal.pbio.0060079. Through archaeological evidence of kill sites, it is also well documented that humans hunted these animals. A 2012 study concluded that no single factor was exclusively responsible for the extinction of these magnificent creatures. G.M. MacDonald et al., “Pattern of Extinction of the Woolly Mammoth in Beringia.” Nature Communications 3, no. 893 (June 2012), doi:10.1038/ncomms1881. In addition to climate change and reduction of habitat, scientists demonstrated another important factor in the mammoth’s extinction was the migration of human hunters across the Bering Strait to North America during the last ice age 20,000 years ago.

The maintenance of stable populations was and is very complex, with many interacting factors determining the outcome. It is important to remember that humans are also part of nature. Once we contributed to a species’ decline using primitive hunting technology only.

Demographic-based population models

Population ecologists have hypothesized that suites of characteristics may evolve in species that lead to particular adaptations to their environments. These adaptations impact the kind of population growth their species experience. Life history characteristics such as birth rates, age at first reproduction, the numbers of offspring, and even death rates evolve just like anatomy or behavior, leading to adaptations that affect population growth. Population ecologists have described a continuum of life-history “strategies” with K -selected species on one end and r -selected species on the other. K -selected species    are adapted to stable, predictable environments. Populations of K -selected species tend to exist close to their carrying capacity. These species tend to have larger, but fewer, offspring and contribute large amounts of resources to each offspring. Elephants would be an example of a K -selected species. r -selected species    are adapted to unstable and unpredictable environments. They have large numbers of small offspring. Animals that are r -selected do not provide a lot of resources or parental care to offspring, and the offspring are relatively self-sufficient at birth. Examples of r -selected species are marine invertebrates such as jellyfish and plants such as the dandelion. The two extreme strategies are at two ends of a continuum on which real species life histories will exist. In addition, life history strategies do not need to evolve as suites, but can evolve independently of each other, so each species may have some characteristics that trend toward one extreme or the other.

Section summary

Populations with unlimited resources grow exponentially—with an accelerating growth rate. When resources become limiting, populations follow a logistic growth curve in which population size will level off at the carrying capacity.

Populations are regulated by a variety of density-dependent and density-independent factors. Life-history characteristics, such as age at first reproduction or numbers of offspring, are characteristics that evolve in populations just as anatomy or behavior can evolve over time. The model of r - and K -selection suggests that characters, and possibly suites of characters, may evolve adaptations to population stability near the carrying capacity ( K -selection) or rapid population growth and collapse ( r -selection). Species will exhibit adaptations somewhere on a continuum between these two extremes.

Art exercise

[link] If the major food source of seals declines due to pollution or overfishing, which of the following would likely occur?

  1. The carrying capacity of seals would decrease, as would the seal population.
  2. The carrying capacity of seals would decrease, but the seal population would remain the same.
  3. The number of seal deaths would increase, but the number of births would also increase, so the population size would remain the same.
  4. The carrying capacity of seals would remain the same, but the population of seals would decrease.

[link] A: The carrying capacity of seals would decrease, as would the seal population.

Got questions? Get instant answers now!

Questions & Answers

What are the factors that affect demand for a commodity
Florence Reply
differentiate between demand and supply giving examples
Lambiv Reply
differentiated between demand and supply using examples
Lambiv
what is labour ?
Lambiv
how will I do?
Venny Reply
how is the graph works?I don't fully understand
Rezat Reply
information
Eliyee
devaluation
Eliyee
t
WARKISA
hi guys good evening to all
Lambiv
multiple choice question
Aster Reply
appreciation
Eliyee
explain perfect market
Lindiwe Reply
In economics, a perfect market refers to a theoretical construct where all participants have perfect information, goods are homogenous, there are no barriers to entry or exit, and prices are determined solely by supply and demand. It's an idealized model used for analysis,
Ezea
What is ceteris paribus?
Shukri Reply
other things being equal
AI-Robot
When MP₁ becomes negative, TP start to decline. Extuples Suppose that the short-run production function of certain cut-flower firm is given by: Q=4KL-0.6K2 - 0.112 • Where is quantity of cut flower produced, I is labour input and K is fixed capital input (K-5). Determine the average product of lab
Kelo
Extuples Suppose that the short-run production function of certain cut-flower firm is given by: Q=4KL-0.6K2 - 0.112 • Where is quantity of cut flower produced, I is labour input and K is fixed capital input (K-5). Determine the average product of labour (APL) and marginal product of labour (MPL)
Kelo
yes,thank you
Shukri
Can I ask you other question?
Shukri
what is monopoly mean?
Habtamu Reply
What is different between quantity demand and demand?
Shukri Reply
Quantity demanded refers to the specific amount of a good or service that consumers are willing and able to purchase at a give price and within a specific time period. Demand, on the other hand, is a broader concept that encompasses the entire relationship between price and quantity demanded
Ezea
ok
Shukri
how do you save a country economic situation when it's falling apart
Lilia Reply
what is the difference between economic growth and development
Fiker Reply
Economic growth as an increase in the production and consumption of goods and services within an economy.but Economic development as a broader concept that encompasses not only economic growth but also social & human well being.
Shukri
production function means
Jabir
What do you think is more important to focus on when considering inequality ?
Abdisa Reply
any question about economics?
Awais Reply
sir...I just want to ask one question... Define the term contract curve? if you are free please help me to find this answer 🙏
Asui
it is a curve that we get after connecting the pareto optimal combinations of two consumers after their mutually beneficial trade offs
Awais
thank you so much 👍 sir
Asui
In economics, the contract curve refers to the set of points in an Edgeworth box diagram where both parties involved in a trade cannot be made better off without making one of them worse off. It represents the Pareto efficient allocations of goods between two individuals or entities, where neither p
Cornelius
In economics, the contract curve refers to the set of points in an Edgeworth box diagram where both parties involved in a trade cannot be made better off without making one of them worse off. It represents the Pareto efficient allocations of goods between two individuals or entities,
Cornelius
Suppose a consumer consuming two commodities X and Y has The following utility function u=X0.4 Y0.6. If the price of the X and Y are 2 and 3 respectively and income Constraint is birr 50. A,Calculate quantities of x and y which maximize utility. B,Calculate value of Lagrange multiplier. C,Calculate quantities of X and Y consumed with a given price. D,alculate optimum level of output .
Feyisa Reply
Answer
Feyisa
c
Jabir
the market for lemon has 10 potential consumers, each having an individual demand curve p=101-10Qi, where p is price in dollar's per cup and Qi is the number of cups demanded per week by the i th consumer.Find the market demand curve using algebra. Draw an individual demand curve and the market dema
Gsbwnw Reply
suppose the production function is given by ( L, K)=L¼K¾.assuming capital is fixed find APL and MPL. consider the following short run production function:Q=6L²-0.4L³ a) find the value of L that maximizes output b)find the value of L that maximizes marginal product
Abdureman
Got questions? Join the online conversation and get instant answers!
Jobilize.com Reply

Get Jobilize Job Search Mobile App in your pocket Now!

Get it on Google Play Download on the App Store Now


Source:  OpenStax, Concepts of biology. OpenStax CNX. Feb 29, 2016 Download for free at http://cnx.org/content/col11487/1.9
Google Play and the Google Play logo are trademarks of Google Inc.

Notification Switch

Would you like to follow the 'Concepts of biology' conversation and receive update notifications?

Ask