<< Chapter < Page Chapter >> Page >
By the end of this section, you will be able to:
  • Identify the two major abiotic factors that determine the type of terrestrial biome in an area
  • Recognize distinguishing characteristics of each of the eight major terrestrial biomes

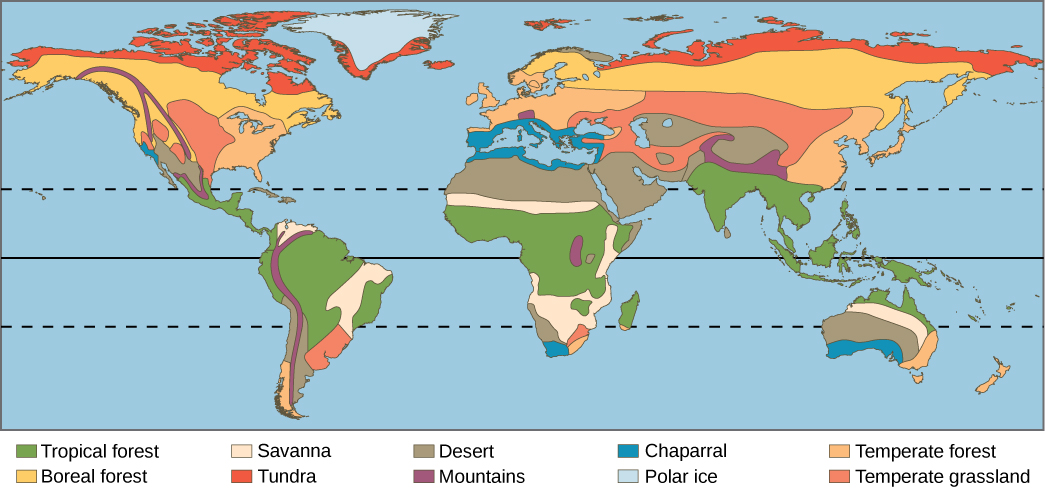
Earth’s biomes can be either terrestrial or aquatic. Terrestrial biomes are based on land, while aquatic biomes include both ocean and freshwater biomes. The eight major terrestrial biomes on Earth are each distinguished by characteristic temperatures and amount of precipitation. Annual totals and fluctuations of precipitation affect the kinds of vegetation and animal life that can exist in broad geographical regions. Temperature variation on a daily and seasonal basis is also important for predicting the geographic distribution of a biome. Since a biome is defined by climate, the same biome can occur in geographically distinct areas with similar climates ( [link] ). There are also large areas on Antarctica, Greenland, and in mountain ranges that are covered by permanent glaciers and support very little life. Strictly speaking, these are not considered biomes and in addition to extremes of cold, they are also often deserts with very low precipitation.

A world map shows the eight major biomes, polar ice caps, and mountains. Tropical forests, deserts and savannas are found primarily in South America, Africa and Australia. Tropical forests also dominate southeast Asia. Deserts dominate the Middle East and are found in the southwestern United States. Temperate forests dominate the eastern United States, Europe and Eastern Asia. Temperate grasslands dominate the midwestern United States and parts of Asia, and are also found in South America. Boreal forest is found in northern Canada, Europe and Asia, and tundra exists to the north of the boreal forests. Mountainous regions run the length of North and South America, and are found in northern India, Africa and parts of Europe. Polar ice covers Greenland and Antarctica, the latter is not shown on the map.
Each of the world’s eight major biomes is distinguished by characteristic temperatures and amount of precipitation. Polar ice caps and mountains are also shown.

Tropical forest

Tropical rainforests are also referred to as tropical wet forests. This biome is found in equatorial regions ( [link] ). Tropical rainforests are the most diverse terrestrial biome. This biodiversity is still largely unknown to science and is under extraordinary threat primarily through logging and deforestation for agriculture. Tropical rainforests have also been described as nature’s pharmacy because of the potential for new drugs that is largely hidden in the chemicals produced by the huge diversity of plants, animals, and other organisms. The vegetation is characterized by plants with spreading roots and broad leaves that fall off throughout the year, unlike the trees of deciduous forests that lose their leaves in one season. These forests are “evergreen,” year-round.

The temperature and sunlight profiles of tropical rainforests are stable in comparison to that of other terrestrial biomes, with average temperatures ranging from 20 o C to 34 o C (68 o F to 93 o F). Month-to-month temperatures are relatively constant in tropical rainforests, in contrast to forests further from the equator. This lack of temperature seasonality leads to year-round plant growth, rather than the seasonal growth seen in other biomes. In contrast to other ecosystems, a more constant daily amount of sunlight (11–12 hours per day) provides more solar radiation, thereby a longer period of time for plant growth.

The annual rainfall in tropical rainforests ranges from 250 cm to more than 450 cm (8.2–14.8 ft) with considerable seasonal variation. Tropical rainforests have wet months in which there can be more than 30 cm (11–12 in) of precipitation, as well as dry months in which there are fewer than 10 cm (3.5 in) of rainfall. However, the driest month of a tropical rainforest can still exceed the annual rainfall of some other biomes, such as deserts.

Questions & Answers

how do you get the 2/50
Abba Reply
number of sport play by 50 student construct discrete data
Aminu Reply
width of the frangebany leaves on how to write a introduction
Theresa Reply
Solve the mean of variance
Veronica Reply
Step 1: Find the mean. To find the mean, add up all the scores, then divide them by the number of scores. ... Step 2: Find each score's deviation from the mean. ... Step 3: Square each deviation from the mean. ... Step 4: Find the sum of squares. ... Step 5: Divide the sum of squares by n – 1 or N.
kenneth
what is error
Yakuba Reply
Is mistake done to something
Vutshila
Hy
anas
hy
What is the life teble
anas
hy
Jibrin
statistics is the analyzing of data
Tajudeen Reply
what is statics?
Zelalem Reply
how do you calculate mean
Gloria Reply
diveving the sum if all values
Shaynaynay
let A1,A2 and A3 events be independent,show that (A1)^c, (A2)^c and (A3)^c are independent?
Fisaye Reply
what is statistics
Akhisani Reply
data collected all over the world
Shaynaynay
construct a less than and more than table
Imad Reply
The sample of 16 students is taken. The average age in the sample was 22 years with astandard deviation of 6 years. Construct a 95% confidence interval for the age of the population.
Aschalew Reply
Bhartdarshan' is an internet-based travel agency wherein customer can see videos of the cities they plant to visit. The number of hits daily is a normally distributed random variable with a mean of 10,000 and a standard deviation of 2,400 a. what is the probability of getting more than 12,000 hits? b. what is the probability of getting fewer than 9,000 hits?
Akshay Reply
Bhartdarshan'is an internet-based travel agency wherein customer can see videos of the cities they plan to visit. The number of hits daily is a normally distributed random variable with a mean of 10,000 and a standard deviation of 2,400. a. What is the probability of getting more than 12,000 hits
Akshay
1
Bright
Sorry i want to learn more about this question
Bright
Someone help
Bright
a= 0.20233 b=0.3384
Sufiyan
a
Shaynaynay
How do I interpret level of significance?
Mohd Reply
It depends on your business problem or in Machine Learning you could use ROC- AUC cruve to decide the threshold value
Shivam
how skewness and kurtosis are used in statistics
Owen Reply
yes what is it
Taneeya
Got questions? Join the online conversation and get instant answers!
Jobilize.com Reply

Get Jobilize Job Search Mobile App in your pocket Now!

Get it on Google Play Download on the App Store Now


Source:  OpenStax, Concepts of biology. OpenStax CNX. Feb 29, 2016 Download for free at http://cnx.org/content/col11487/1.9
Google Play and the Google Play logo are trademarks of Google Inc.

Notification Switch

Would you like to follow the 'Concepts of biology' conversation and receive update notifications?

Ask