<< Chapter < Page Chapter >> Page >
By the end of this section, you will be able to:
  • Explain sources of evidence for evolution
  • Define homologous and vestigial structures

The evidence for evolution is compelling and extensive. Looking at every level of organization in living systems, biologists see the signature of past and present evolution. Darwin dedicated a large portion of his book, On the Origin of Species , identifying patterns in nature that were consistent with evolution and since Darwin our understanding has become clearer and broader.

Fossils

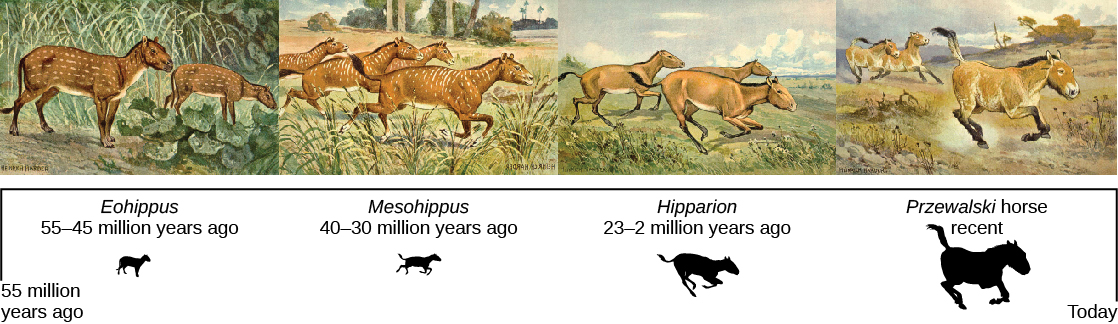
Fossils provide solid evidence that organisms from the past are not the same as those found today; fossils show a progression of evolution. Scientists determine the age of fossils and categorize them all over the world to determine when the organisms lived relative to each other. The resulting fossil record tells the story of the past, and shows the evolution of form over millions of years ( [link] ). For example, highly detailed fossil records have been recovered for sequences of species in the evolution of whales and modern horses. The fossil record of horses in North America is especially rich and many contain transition fossils: those showing intermediate anatomy between earlier and later forms. The fossil record extends back to a dog-like ancestor some 55 million years ago that gave rise to the first horse-like species 55 to 42 million years ago in the genus Eohippus . The series of fossils tracks the change in anatomy resulting from a gradual drying trend that changed the landscape from a forested one to a prairie. Successive fossils show the evolution of teeth shapes and foot and leg anatomy to a grazing habit, with adaptations for escaping predators, for example in species of Mesohippus found from 40 to 30 million years ago. Later species showed gains in size, such as those of Hipparion , which existed from about 23 to 2 million years ago. The fossil record shows several adaptive radiations in the horse lineage, which is now much reduced to only one genus, Equus , with several species.

A series of paintings on a timeline from 55 million years ago to today showing 4 of the ancestors to the modern horse. The first in the series is Eohippus, which lived from 55 to 45 million years ago. It was a small, dog-sized, animal with 4 toes on the front feet and 3 on the back, a long tail, and a brown spotted coat. The second is Mesohippus, which lived from 40 to 30 million years ago. It was slightly larger than Eohippus with longer legs. It had 3 toes on the front and back feet. The third is Hipparion, which lived from 23 to 2 million years ago. It walked on its middle toe on each foot (now a hoof), but it still had vestiges of the remaining toes. It was much larger than Hipparion. The fourth is Przewalski’s horse, a recent but endangered horse. It is smaller and stockier than the domesticated horse with one toe (hoof) on each foot.
This illustration shows an artist’s renderings of these species derived from fossils of the evolutionary history of the horse and its ancestors. The species depicted are only four from a very diverse lineage that contains many branches, dead ends, and adaptive radiations. One of the trends, depicted here is the evolutionary tracking of a drying climate and increase in prairie versus forest habitat reflected in forms that are more adapted to grazing and predator escape through running. Przewalski's horse is one of a few living species of horse.

Anatomy and embryology

Another type of evidence for evolution is the presence of structures in organisms that share the same basic form. For example, the bones in the appendages of a human, dog, bird, and whale all share the same overall construction ( [link] ). That similarity results from their origin in the appendages of a common ancestor. Over time, evolution led to changes in the shapes and sizes of these bones in different species, but they have maintained the same overall layout, evidence of descent from a common ancestor. Scientists call these synonymous parts homologous structures. Some structures exist in organisms that have no apparent function at all, and appear to be residual parts from a past ancestor. For example, some snakes have pelvic bones despite having no legs because they descended from reptiles that did have legs. These unused structures without function are called vestigial structures . Other examples of vestigial structures are wings on flightless birds (which may have other functions), leaves on some cacti, traces of pelvic bones in whales, and the sightless eyes of cave animals.

Questions & Answers

differentiate between demand and supply giving examples
Lambiv Reply
differentiated between demand and supply using examples
Lambiv
what is labour ?
Lambiv
how will I do?
Venny Reply
how is the graph works?I don't fully understand
Rezat Reply
information
Eliyee
devaluation
Eliyee
t
WARKISA
hi guys good evening to all
Lambiv
multiple choice question
Aster Reply
appreciation
Eliyee
explain perfect market
Lindiwe Reply
In economics, a perfect market refers to a theoretical construct where all participants have perfect information, goods are homogenous, there are no barriers to entry or exit, and prices are determined solely by supply and demand. It's an idealized model used for analysis,
Ezea
What is ceteris paribus?
Shukri Reply
other things being equal
AI-Robot
When MP₁ becomes negative, TP start to decline. Extuples Suppose that the short-run production function of certain cut-flower firm is given by: Q=4KL-0.6K2 - 0.112 • Where is quantity of cut flower produced, I is labour input and K is fixed capital input (K-5). Determine the average product of lab
Kelo
Extuples Suppose that the short-run production function of certain cut-flower firm is given by: Q=4KL-0.6K2 - 0.112 • Where is quantity of cut flower produced, I is labour input and K is fixed capital input (K-5). Determine the average product of labour (APL) and marginal product of labour (MPL)
Kelo
yes,thank you
Shukri
Can I ask you other question?
Shukri
what is monopoly mean?
Habtamu Reply
What is different between quantity demand and demand?
Shukri Reply
Quantity demanded refers to the specific amount of a good or service that consumers are willing and able to purchase at a give price and within a specific time period. Demand, on the other hand, is a broader concept that encompasses the entire relationship between price and quantity demanded
Ezea
ok
Shukri
how do you save a country economic situation when it's falling apart
Lilia Reply
what is the difference between economic growth and development
Fiker Reply
Economic growth as an increase in the production and consumption of goods and services within an economy.but Economic development as a broader concept that encompasses not only economic growth but also social & human well being.
Shukri
production function means
Jabir
What do you think is more important to focus on when considering inequality ?
Abdisa Reply
any question about economics?
Awais Reply
sir...I just want to ask one question... Define the term contract curve? if you are free please help me to find this answer 🙏
Asui
it is a curve that we get after connecting the pareto optimal combinations of two consumers after their mutually beneficial trade offs
Awais
thank you so much 👍 sir
Asui
In economics, the contract curve refers to the set of points in an Edgeworth box diagram where both parties involved in a trade cannot be made better off without making one of them worse off. It represents the Pareto efficient allocations of goods between two individuals or entities, where neither p
Cornelius
In economics, the contract curve refers to the set of points in an Edgeworth box diagram where both parties involved in a trade cannot be made better off without making one of them worse off. It represents the Pareto efficient allocations of goods between two individuals or entities,
Cornelius
Suppose a consumer consuming two commodities X and Y has The following utility function u=X0.4 Y0.6. If the price of the X and Y are 2 and 3 respectively and income Constraint is birr 50. A,Calculate quantities of x and y which maximize utility. B,Calculate value of Lagrange multiplier. C,Calculate quantities of X and Y consumed with a given price. D,alculate optimum level of output .
Feyisa Reply
Answer
Feyisa
c
Jabir
the market for lemon has 10 potential consumers, each having an individual demand curve p=101-10Qi, where p is price in dollar's per cup and Qi is the number of cups demanded per week by the i th consumer.Find the market demand curve using algebra. Draw an individual demand curve and the market dema
Gsbwnw Reply
suppose the production function is given by ( L, K)=L¼K¾.assuming capital is fixed find APL and MPL. consider the following short run production function:Q=6L²-0.4L³ a) find the value of L that maximizes output b)find the value of L that maximizes marginal product
Abdureman
types of unemployment
Yomi Reply
What is the difference between perfect competition and monopolistic competition?
Mohammed
Got questions? Join the online conversation and get instant answers!
Jobilize.com Reply

Get Jobilize Job Search Mobile App in your pocket Now!

Get it on Google Play Download on the App Store Now


Source:  OpenStax, Concepts of biology. OpenStax CNX. Feb 29, 2016 Download for free at http://cnx.org/content/col11487/1.9
Google Play and the Google Play logo are trademarks of Google Inc.

Notification Switch

Would you like to follow the 'Concepts of biology' conversation and receive update notifications?

Ask