<< Chapter < Page Chapter >> Page >
Part A shows a eukaryotic cell. The illustration indicates that, within the nucleus, operational genes were inherited from an ancestral Eubacteria, and informational genes were inherited from an ancestral Archaebacteria. Part B indicates that the outer membrane of Gram-negative bacteria is derived from Archaea, and the inner membrane is derived from Gram-positive bacteria.
The theory that mitochondria and chloroplasts are endosymbiotic in origin is now widely accepted. More controversial is the proposal that (a) the eukaryotic nucleus resulted from the fusion of archaeal and bacterial genomes, and that (b) Gram-negative bacteria, which have two membranes, resulted from the fusion of Archaea and Gram-positive bacteria, each of which has a single membrane.

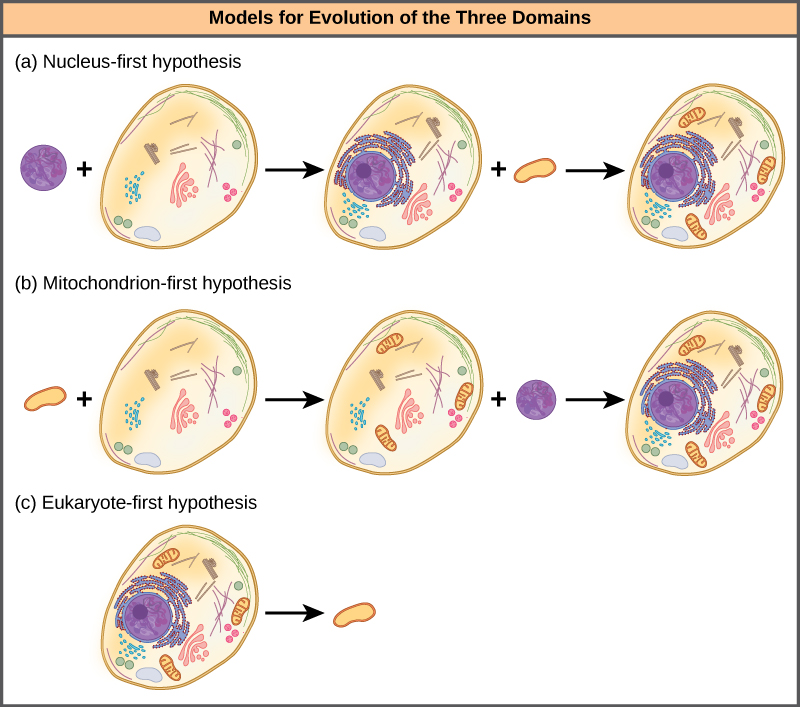
The nucleus-first hypothesis proposes that the nucleus evolved in prokaryotes first ( [link] a ), followed by a later fusion of the new eukaryote with bacteria that became mitochondria. The mitochondria-first hypothesis proposes that mitochondria were first established in a prokaryotic host ( [link] b ), which subsequently acquired a nucleus, by fusion or other mechanisms, to become the first eukaryotic cell. Most interestingly, the eukaryote-first hypothesis proposes that prokaryotes actually evolved from eukaryotes by losing genes and complexity ( [link] c ). All of these hypotheses are testable. Only time and more experimentation will determine which hypothesis is best supported by data.

 Part A shows the nucleus-first hypothesis. According to this hypothesis, a primary endosymbiotic event resulted in an ancestral eukaryotic cell acquiring a nucleus, and a secondary endosymbiotic event resulted in the acquisition of a mitochondrion. Part B shows the mitochondrion-first hypothesis. According to this hypothesis, the mitochondrion was acquired before the nucleus, but both were acquired by endosymbiosis. Part C shows the eukaryote-first hypothesis. According to this hypothesis, prokaryotes evolved from eukaryotic cells that lost their nuclei and organelles.
Three alternate hypotheses of eukaryotic and prokaryotic evolution are (a) the nucleus-first hypothesis, (b) the mitochondrion-first hypothesis, and (c) the eukaryote-first hypothesis.

Web and network models

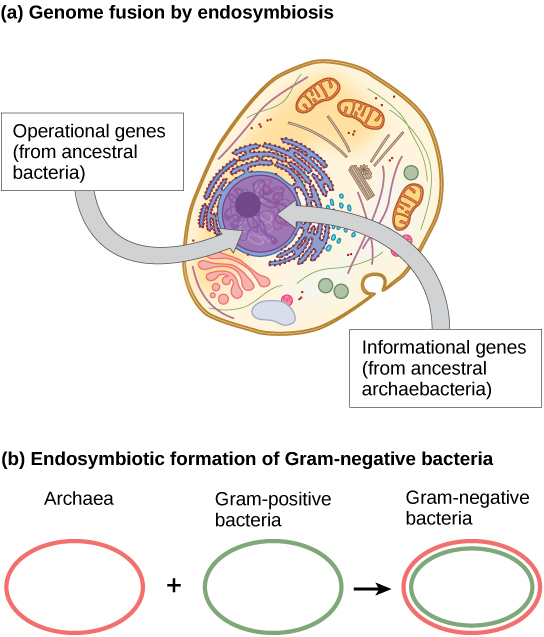
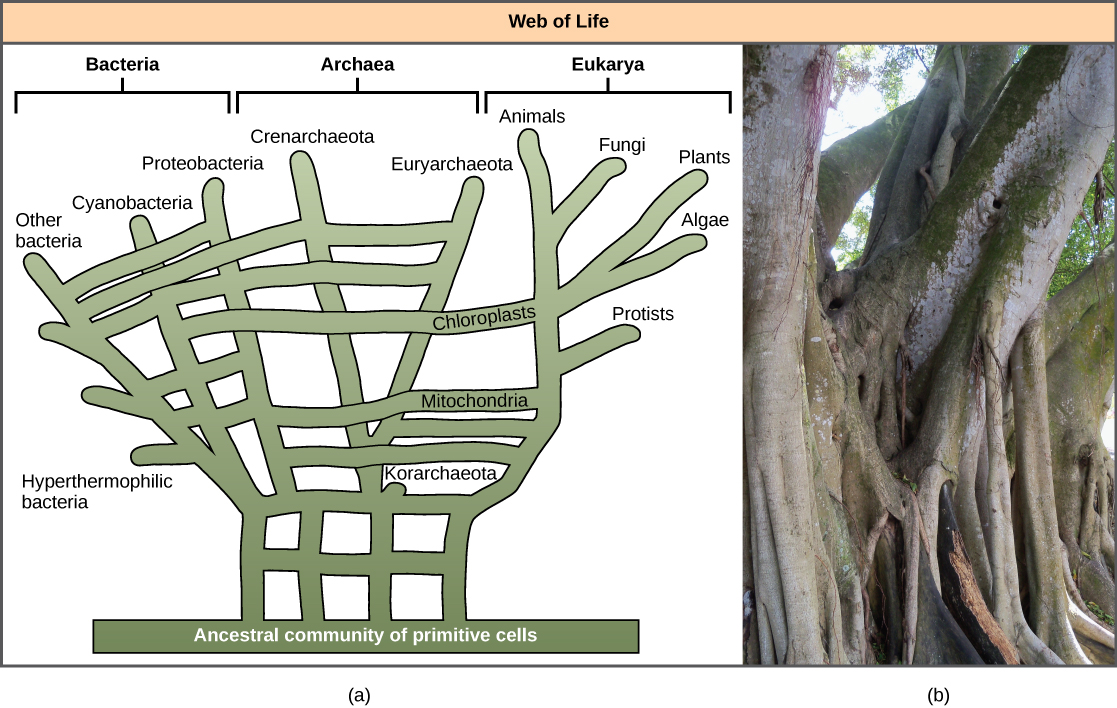
The recognition of the importance of HGT, especially in the evolution of prokaryotes, has caused some to propose abandoning the classic “tree of life” model. In 1999, W. Ford Doolittle proposed a phylogenetic model that resembles a web or a network more than a tree. The hypothesis is that eukaryotes evolved not from a single prokaryotic ancestor, but from a pool of many species that were sharing genes by HGT mechanisms. As shown in [link] a , some individual prokaryotes were responsible for transferring the bacteria that caused mitochondrial development to the new eukaryotes, whereas other species transferred the bacteria that gave rise to chloroplasts. This model is often called the “ web of life    .” In an effort to save the tree analogy, some have proposed using the Ficus tree ( [link] b ) with its multiple trunks as a phylogenetic to represent a diminished evolutionary role for HGT.

 Illustration (a) shows the web of life. The base of this web is an ancestral community of primitive cells. This pool of ancestral cells gave rise to the three domains of life. However, because of gene transfer and endosymbiosis events, connections occur between the branches at various points. Thus, eukaryotic chloroplasts and mitochondria originated in bacterial lineages, and archaea and bacteria have exchanged genes.
In the (a) phylogenetic model proposed by W. Ford Doolittle, the “tree of life” arose from a community of ancestral cells, has multiple trunks, and has connections between branches where horizontal gene transfer has occurred. Visually, this concept is better represented by (b) the multi-trunked Ficus than by the single trunk of the oak similar to the tree drawn by Darwin [link] . (credit b: modification of work by "psyberartist"/Flickr)

Ring of life models

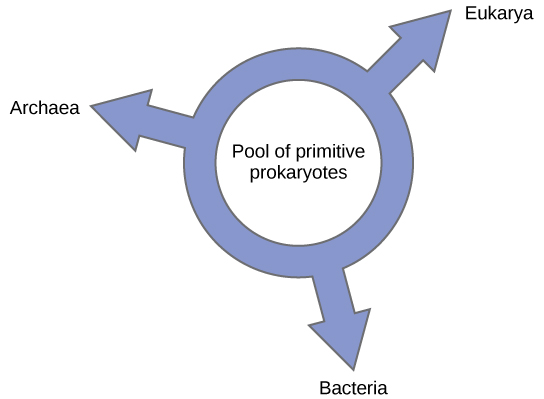
Others have proposed abandoning any tree-like model of phylogeny in favor of a ring structure, the so-called “ ring of life    ” ( [link] ); a phylogenetic model where all three domains of life evolved from a pool of primitive prokaryotes. Lake, again using the conditioned reconstruction algorithm, proposes a ring-like model in which species of all three domains—Archaea, Bacteria, and Eukarya—evolved from a single pool of gene-swapping prokaryotes. His laboratory proposes that this structure is the best fit for data from extensive DNA analyses performed in his laboratory, and that the ring model is the only one that adequately takes HGT and genomic fusion into account. However, other phylogeneticists remain highly skeptical of this model.

Illustration shows a ring with the words “pool of primitive prokaryotes” in the middle. Three arrows point outward from the ring, pointing at the three domains, Bacteria, Archaea, and Eukarya, indicating that all three domains arose from a common pool of prokaryotes.
According to the “ring of life” phylogenetic model, the three domains of life evolved from a pool of primitive prokaryotes.

In summary, the “tree of life” model proposed by Darwin must be modified to include HGT. Does this mean abandoning the tree model completely? Even Lake argues that all attempts should be made to discover some modification of the tree model to allow it to accurately fit his data, and only the inability to do so will sway people toward his ring proposal.

This doesn’t mean a tree, web, or a ring will correlate completely to an accurate description of phylogenetic relationships of life. A consequence of the new thinking about phylogenetic models is the idea that Darwin’s original conception of the phylogenetic tree is too simple, but made sense based on what was known at the time. However, the search for a more useful model moves on: each model serving as hypotheses to be tested with the possibility of developing new models. This is how science advances. These models are used as visualizations to help construct hypothetical evolutionary relationships and understand the massive amount of data being analyzed.

Section summary

The phylogenetic tree, first used by Darwin, is the classic “tree of life” model describing phylogenetic relationships among species, and the most common model used today. New ideas about HGT and genome fusion have caused some to suggest revising the model to resemble webs or rings.

Questions & Answers

What are the factors that affect demand for a commodity
Florence Reply
differentiate between demand and supply giving examples
Lambiv Reply
differentiated between demand and supply using examples
Lambiv
what is labour ?
Lambiv
how will I do?
Venny Reply
how is the graph works?I don't fully understand
Rezat Reply
information
Eliyee
devaluation
Eliyee
t
WARKISA
hi guys good evening to all
Lambiv
multiple choice question
Aster Reply
appreciation
Eliyee
explain perfect market
Lindiwe Reply
In economics, a perfect market refers to a theoretical construct where all participants have perfect information, goods are homogenous, there are no barriers to entry or exit, and prices are determined solely by supply and demand. It's an idealized model used for analysis,
Ezea
What is ceteris paribus?
Shukri Reply
other things being equal
AI-Robot
When MP₁ becomes negative, TP start to decline. Extuples Suppose that the short-run production function of certain cut-flower firm is given by: Q=4KL-0.6K2 - 0.112 • Where is quantity of cut flower produced, I is labour input and K is fixed capital input (K-5). Determine the average product of lab
Kelo
Extuples Suppose that the short-run production function of certain cut-flower firm is given by: Q=4KL-0.6K2 - 0.112 • Where is quantity of cut flower produced, I is labour input and K is fixed capital input (K-5). Determine the average product of labour (APL) and marginal product of labour (MPL)
Kelo
yes,thank you
Shukri
Can I ask you other question?
Shukri
what is monopoly mean?
Habtamu Reply
What is different between quantity demand and demand?
Shukri Reply
Quantity demanded refers to the specific amount of a good or service that consumers are willing and able to purchase at a give price and within a specific time period. Demand, on the other hand, is a broader concept that encompasses the entire relationship between price and quantity demanded
Ezea
ok
Shukri
how do you save a country economic situation when it's falling apart
Lilia Reply
what is the difference between economic growth and development
Fiker Reply
Economic growth as an increase in the production and consumption of goods and services within an economy.but Economic development as a broader concept that encompasses not only economic growth but also social & human well being.
Shukri
production function means
Jabir
What do you think is more important to focus on when considering inequality ?
Abdisa Reply
any question about economics?
Awais Reply
sir...I just want to ask one question... Define the term contract curve? if you are free please help me to find this answer 🙏
Asui
it is a curve that we get after connecting the pareto optimal combinations of two consumers after their mutually beneficial trade offs
Awais
thank you so much 👍 sir
Asui
In economics, the contract curve refers to the set of points in an Edgeworth box diagram where both parties involved in a trade cannot be made better off without making one of them worse off. It represents the Pareto efficient allocations of goods between two individuals or entities, where neither p
Cornelius
In economics, the contract curve refers to the set of points in an Edgeworth box diagram where both parties involved in a trade cannot be made better off without making one of them worse off. It represents the Pareto efficient allocations of goods between two individuals or entities,
Cornelius
Suppose a consumer consuming two commodities X and Y has The following utility function u=X0.4 Y0.6. If the price of the X and Y are 2 and 3 respectively and income Constraint is birr 50. A,Calculate quantities of x and y which maximize utility. B,Calculate value of Lagrange multiplier. C,Calculate quantities of X and Y consumed with a given price. D,alculate optimum level of output .
Feyisa Reply
Answer
Feyisa
c
Jabir
the market for lemon has 10 potential consumers, each having an individual demand curve p=101-10Qi, where p is price in dollar's per cup and Qi is the number of cups demanded per week by the i th consumer.Find the market demand curve using algebra. Draw an individual demand curve and the market dema
Gsbwnw Reply
suppose the production function is given by ( L, K)=L¼K¾.assuming capital is fixed find APL and MPL. consider the following short run production function:Q=6L²-0.4L³ a) find the value of L that maximizes output b)find the value of L that maximizes marginal product
Abdureman
Got questions? Join the online conversation and get instant answers!
Jobilize.com Reply

Get Jobilize Job Search Mobile App in your pocket Now!

Get it on Google Play Download on the App Store Now


Source:  OpenStax, Biology. OpenStax CNX. Feb 29, 2016 Download for free at http://cnx.org/content/col11448/1.10
Google Play and the Google Play logo are trademarks of Google Inc.

Notification Switch

Would you like to follow the 'Biology' conversation and receive update notifications?

Ask