<< Chapter < Page Chapter >> Page >

Review the anatomical structure of the eye, clicking on each part to practice identification.

Transduction of light

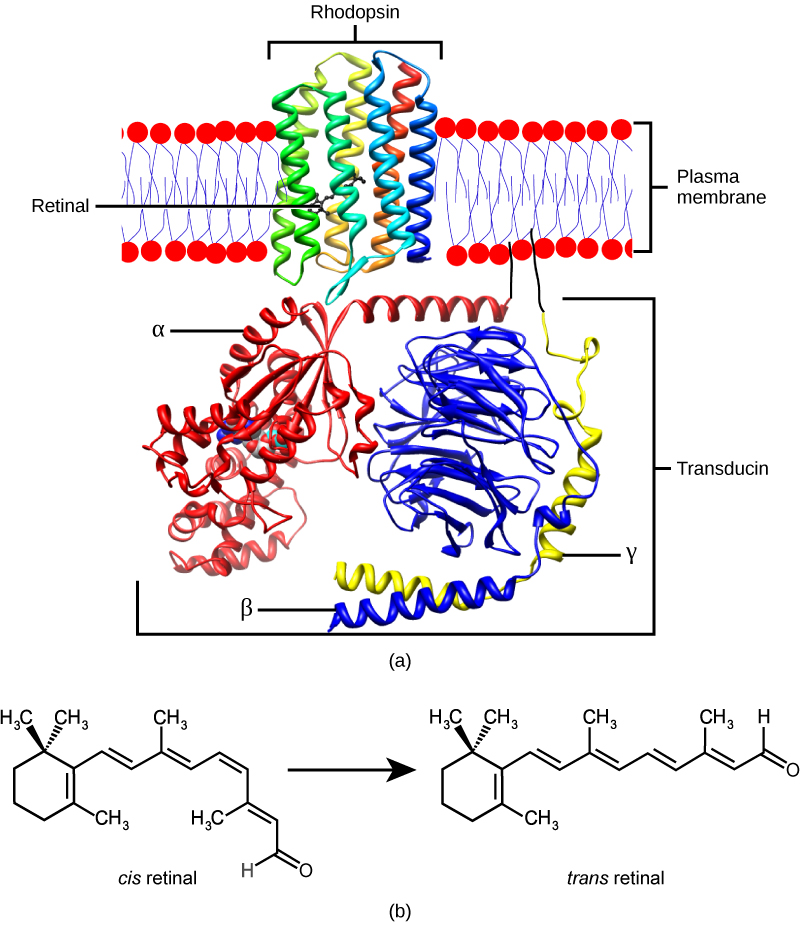
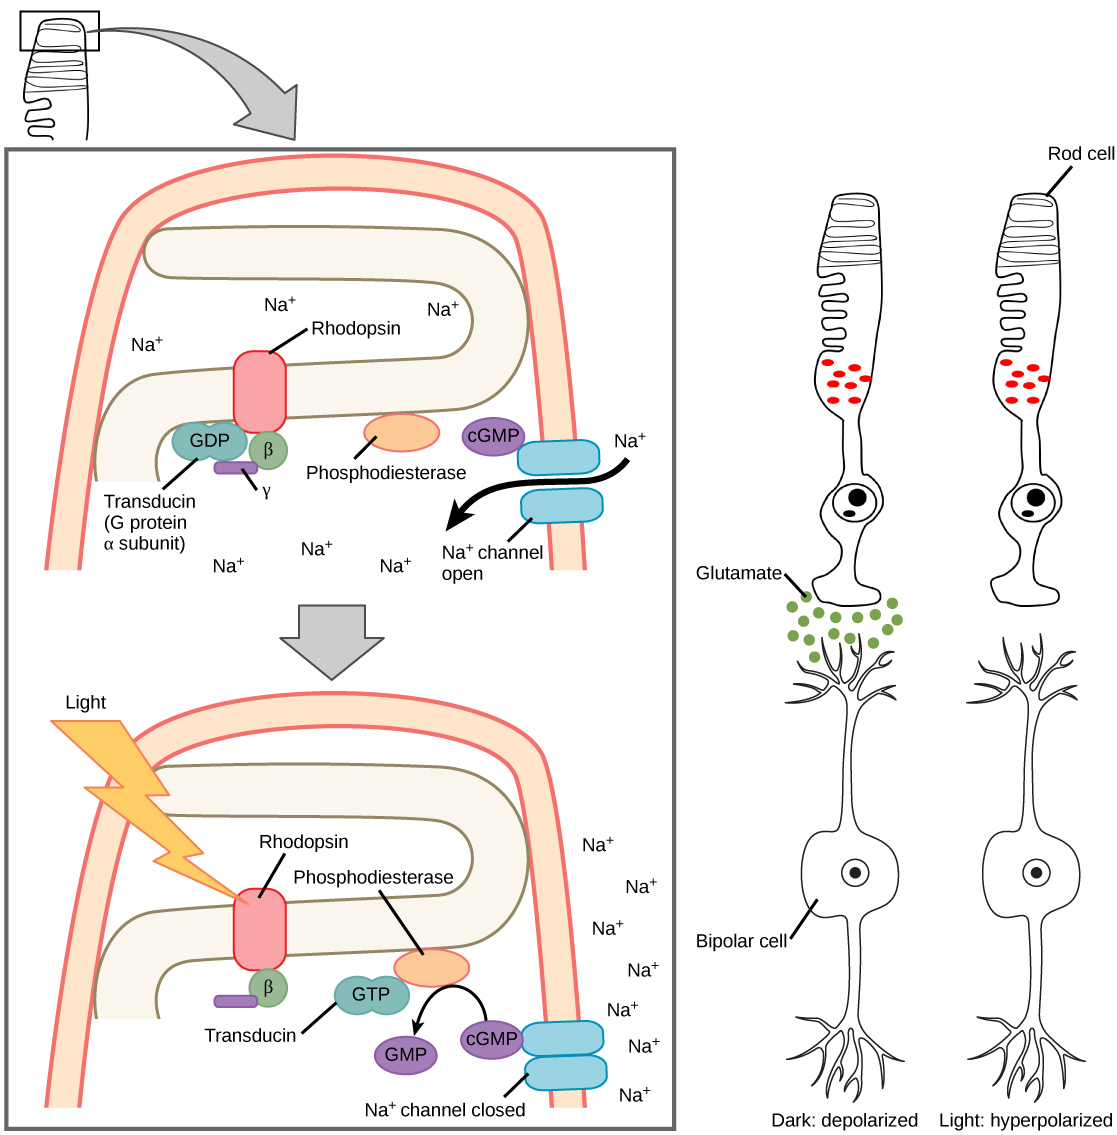
The rods and cones are the site of transduction of light to a neural signal. Both rods and cones contain photopigments. In vertebrates, the main photopigment, rhodopsin    , has two main parts [link] ): an opsin, which is a membrane protein (in the form of a cluster of α-helices that span the membrane), and retinal—a molecule that absorbs light. When light hits a photoreceptor, it causes a shape change in the retinal, altering its structure from a bent ( cis ) form of the molecule to its linear ( trans ) isomer. This isomerization of retinal activates the rhodopsin, starting a cascade of events that ends with the closing of Na + channels in the membrane of the photoreceptor. Thus, unlike most other sensory neurons (which become depolarized by exposure to a stimulus) visual receptors become hyperpolarized and thus driven away from threshold ( [link] ).

 Molecular model A shows the structure of rhodopsin, a trans-membrane protein with seven helices spanning the membrane. A small organic molecule called retinal is tucked inside. B shows the molecular structure of retinal, which has a ring with a hydrocarbon chain attached. A ketone (double bonded oxygen) is at the end of the chain. In cis retinal the chain is kinked. In trans retinal the chain is straight.
(a) Rhodopsin, the photoreceptor in vertebrates, has two parts: the trans-membrane protein opsin, and retinal. When light strikes retinal, it changes shape from (b) a cis to a trans form. The signal is passed to a G-protein called transducin, triggering a series of downstream events.
Illustration A shows the signal transduction pathway for rhodopsin, which is located in internal membranes at the top of rod cells. When light strikes rhodopsin, a G protein called transducing is activated. Transducin has three subunits, alpha, beta and gamma. Upon activation, GDP on the alpha subunit is replaced with GTP. The subunit dissociates, and binds phosphodiesterase. Phosphodiesterase, in turn, converts cGMP to GMP, which closes sodium ion channels. As a result, sodium can no longer enter the cell, and the membrane becomes hyperpolarized. Illustration b shows that the tall, thin rod cell is stacked on top of a bipolar nerve cell. In the dark the membrane is depolarized, and glutamate is released from the rod cell to the axon terminal of the bipolar cell. In the light, no glutamate is released.
When light strikes rhodopsin, the G-protein transducin is activated, which in turn activates phosphodiesterase. Phosphodiesterase converts cGMP to GMP, thereby closing sodium channels. As a result, the membrane becomes hyperpolarized. The hyperpolarized membrane does not release glutamate to the bipolar cell.

Trichromatic coding

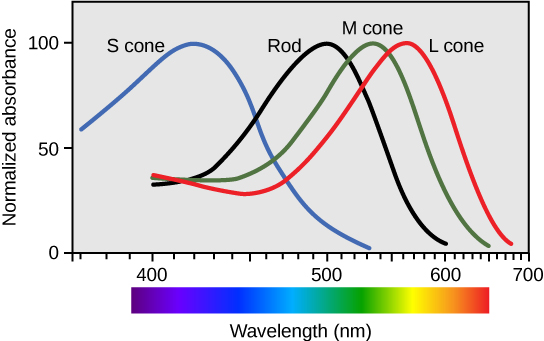
There are three types of cones (with different photopsins), and they differ in the wavelength to which they are most responsive, as shown in [link] . Some cones are maximally responsive to short light waves of 420 nm, so they are called S cones (“S” for “short”); others respond maximally to waves of 530 nm (M cones, for “medium”); a third group responds maximally to light of longer wavelengths, at 560 nm (L, or “long” cones). With only one type of cone, color vision would not be possible, and a two-cone (dichromatic) system has limitations. Primates use a three-cone (trichromatic) system, resulting in full color vision.

The color we perceive is a result of the ratio of activity of our three types of cones. The colors of the visual spectrum, running from long-wavelength light to short, are red (700 nm), orange (600 nm), yellow (565 nm), green (497 nm), blue (470 nm), indigo (450 nm), and violet (425 nm). Humans have very sensitive perception of color and can distinguish about 500 levels of brightness, 200 different hues, and 20 steps of saturation, or about 2 million distinct colors.

 Graph plots normalized absorbance for rods and S, M and L cones against wavelength. For all four cell types, the trend is an approximately bell-shaped curve with a steeper decrease than increase. For S cones the peak absorbance is 420 nanometers. For rods the peak absorbance is 498 nanometers. For M cones the peak absorbance is 534 nanometers. For L cones the peak absorbance is 564 nanometers.
Human rod cells and the different types of cone cells each have an optimal wavelength. However, there is considerable overlap in the wavelengths of light detected.

Retinal processing

Visual signals leave the cones and rods, travel to the bipolar cells, and then to ganglion cells. A large degree of processing of visual information occurs in the retina itself, before visual information is sent to the brain.

Questions & Answers

differentiate between demand and supply giving examples
Lambiv Reply
differentiated between demand and supply using examples
Lambiv
what is labour ?
Lambiv
how will I do?
Venny Reply
how is the graph works?I don't fully understand
Rezat Reply
information
Eliyee
devaluation
Eliyee
t
WARKISA
hi guys good evening to all
Lambiv
multiple choice question
Aster Reply
appreciation
Eliyee
explain perfect market
Lindiwe Reply
In economics, a perfect market refers to a theoretical construct where all participants have perfect information, goods are homogenous, there are no barriers to entry or exit, and prices are determined solely by supply and demand. It's an idealized model used for analysis,
Ezea
What is ceteris paribus?
Shukri Reply
other things being equal
AI-Robot
When MP₁ becomes negative, TP start to decline. Extuples Suppose that the short-run production function of certain cut-flower firm is given by: Q=4KL-0.6K2 - 0.112 • Where is quantity of cut flower produced, I is labour input and K is fixed capital input (K-5). Determine the average product of lab
Kelo
Extuples Suppose that the short-run production function of certain cut-flower firm is given by: Q=4KL-0.6K2 - 0.112 • Where is quantity of cut flower produced, I is labour input and K is fixed capital input (K-5). Determine the average product of labour (APL) and marginal product of labour (MPL)
Kelo
yes,thank you
Shukri
Can I ask you other question?
Shukri
what is monopoly mean?
Habtamu Reply
What is different between quantity demand and demand?
Shukri Reply
Quantity demanded refers to the specific amount of a good or service that consumers are willing and able to purchase at a give price and within a specific time period. Demand, on the other hand, is a broader concept that encompasses the entire relationship between price and quantity demanded
Ezea
ok
Shukri
how do you save a country economic situation when it's falling apart
Lilia Reply
what is the difference between economic growth and development
Fiker Reply
Economic growth as an increase in the production and consumption of goods and services within an economy.but Economic development as a broader concept that encompasses not only economic growth but also social & human well being.
Shukri
production function means
Jabir
What do you think is more important to focus on when considering inequality ?
Abdisa Reply
any question about economics?
Awais Reply
sir...I just want to ask one question... Define the term contract curve? if you are free please help me to find this answer 🙏
Asui
it is a curve that we get after connecting the pareto optimal combinations of two consumers after their mutually beneficial trade offs
Awais
thank you so much 👍 sir
Asui
In economics, the contract curve refers to the set of points in an Edgeworth box diagram where both parties involved in a trade cannot be made better off without making one of them worse off. It represents the Pareto efficient allocations of goods between two individuals or entities, where neither p
Cornelius
In economics, the contract curve refers to the set of points in an Edgeworth box diagram where both parties involved in a trade cannot be made better off without making one of them worse off. It represents the Pareto efficient allocations of goods between two individuals or entities,
Cornelius
Suppose a consumer consuming two commodities X and Y has The following utility function u=X0.4 Y0.6. If the price of the X and Y are 2 and 3 respectively and income Constraint is birr 50. A,Calculate quantities of x and y which maximize utility. B,Calculate value of Lagrange multiplier. C,Calculate quantities of X and Y consumed with a given price. D,alculate optimum level of output .
Feyisa Reply
Answer
Feyisa
c
Jabir
the market for lemon has 10 potential consumers, each having an individual demand curve p=101-10Qi, where p is price in dollar's per cup and Qi is the number of cups demanded per week by the i th consumer.Find the market demand curve using algebra. Draw an individual demand curve and the market dema
Gsbwnw Reply
suppose the production function is given by ( L, K)=L¼K¾.assuming capital is fixed find APL and MPL. consider the following short run production function:Q=6L²-0.4L³ a) find the value of L that maximizes output b)find the value of L that maximizes marginal product
Abdureman
types of unemployment
Yomi Reply
What is the difference between perfect competition and monopolistic competition?
Mohammed
Got questions? Join the online conversation and get instant answers!
Jobilize.com Reply

Get Jobilize Job Search Mobile App in your pocket Now!

Get it on Google Play Download on the App Store Now


Source:  OpenStax, Biology. OpenStax CNX. Feb 29, 2016 Download for free at http://cnx.org/content/col11448/1.10
Google Play and the Google Play logo are trademarks of Google Inc.

Notification Switch

Would you like to follow the 'Biology' conversation and receive update notifications?

Ask