<< Chapter < Page Chapter >> Page >
 The pie chart shows that 97.5 percent of water on Earth, or 1,365,000,000 km3, is salt water. The remaining 2.5 percent, or 35,000,000 kilometers cubed, is fresh water. Of the fresh water, 68.9 percent is frozen in glaciers or permanent snow cover. 30.8 percent is groundwater (soil moisture, swamp water, permafrost). The remaining 0.3 percent is in lakes and rivers.
Only 2.5 percent of water on Earth is fresh water, and less than 1 percent of fresh water is easily accessible to living things.

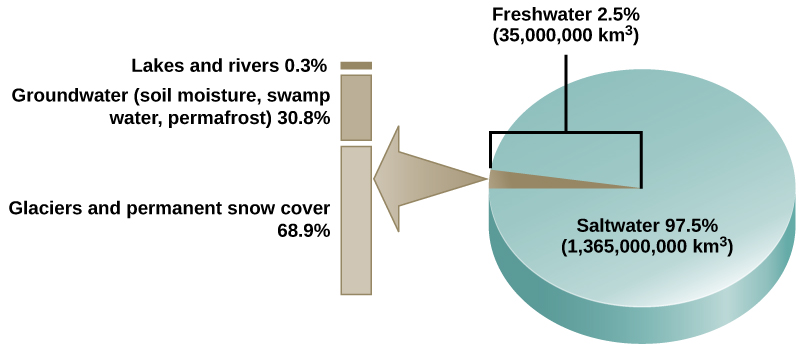
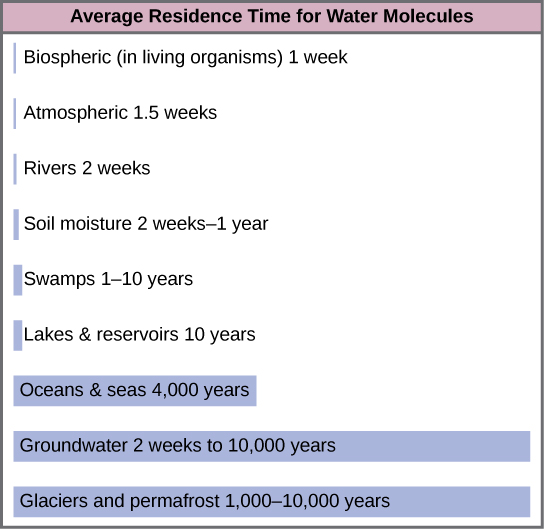
Water cycling is extremely important to ecosystem dynamics. Water has a major influence on climate and, thus, on the environments of ecosystems, some located on distant parts of the Earth. Most of the water on Earth is stored for long periods in the oceans, underground, and as ice. [link] illustrates the average time that an individual water molecule may spend in the Earth’s major water reservoirs. Residence time is a measure of the average time an individual water molecule stays in a particular reservoir. A large amount of the Earth’s water is locked in place in these reservoirs as ice, beneath the ground, and in the ocean, and, thus, is unavailable for short-term cycling (only surface water can evaporate).

 Bars on the graph show the average residence time for water molecules in various reservoirs. The residence time for glaciers and permafrost is 1,000 to 10,000 years. The residence time for groundwater is 2 weeks to 10,000 years. The residence time for oceans and seas is 4,000 years. The residence time for lakes and reservoirs is 10 years. The residence time for swamps is 1 to ten years. The residence time for soil moisture is 2 weeks to 1 year. The residence time for rivers is 2 weeks. The atmospheric residence time is 1.5 weeks. The biospheric residence time, or residence time in living organisms, is 1 week.
This graph shows the average residence time for water molecules in the Earth’s water reservoirs.

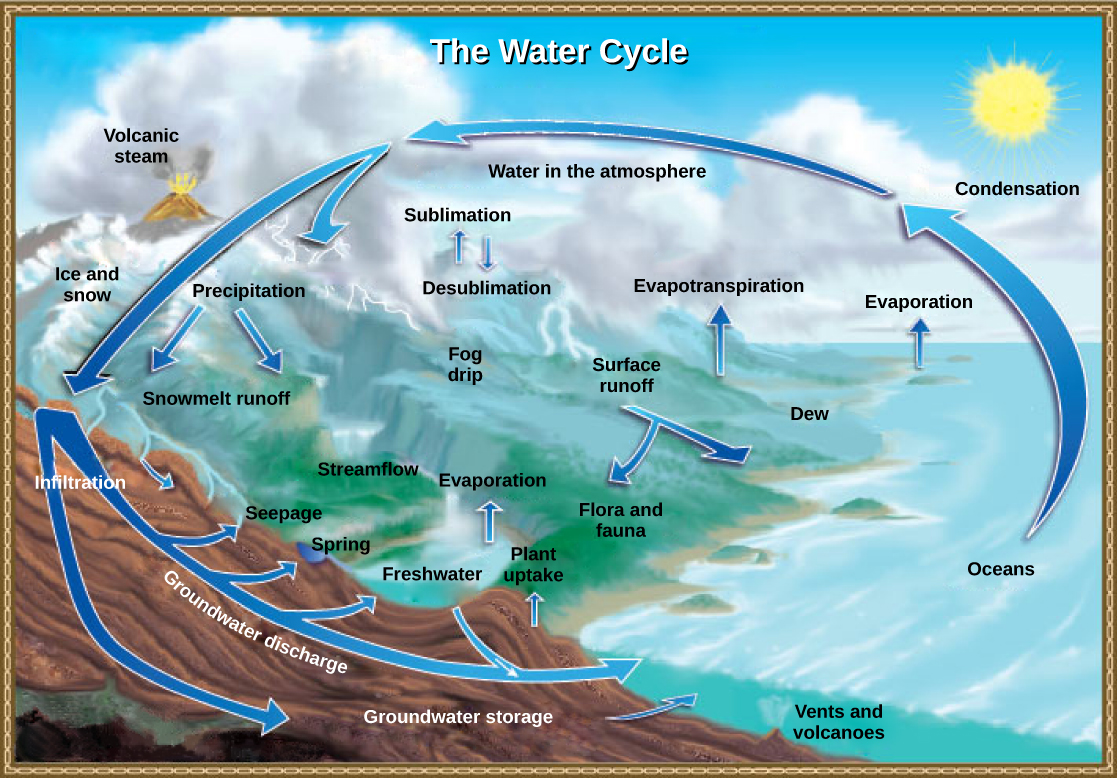
There are various processes that occur during the cycling of water, shown in [link] . These processes include the following:

  • evaporation/sublimation
  • condensation/precipitation
  • subsurface water flow
  • surface runoff/snowmelt
  • streamflow

The water cycle is driven by the sun’s energy as it warms the oceans and other surface waters. This leads to the evaporation (water to water vapor) of liquid surface water and the sublimation (ice to water vapor) of frozen water, which deposits large amounts of water vapor into the atmosphere. Over time, this water vapor condenses into clouds as liquid or frozen droplets and is eventually followed by precipitation (rain or snow), which returns water to the Earth’s surface. Rain eventually permeates into the ground, where it may evaporate again if it is near the surface, flow beneath the surface, or be stored for long periods. More easily observed is surface runoff: the flow of fresh water either from rain or melting ice. Runoff can then make its way through streams and lakes to the oceans or flow directly to the oceans themselves.

Head to this website to learn more about the world’s fresh water supply.

Rain and surface runoff are major ways in which minerals, including carbon, nitrogen, phosphorus, and sulfur, are cycled from land to water. The environmental effects of runoff will be discussed later as these cycles are described.

 Illustration shows the water cycle. Water enters the atmosphere through evaporation, evapotranspiration, sublimation, and volcanic steam. Condensation in the atmosphere turns water vapor into clouds. Water from the atmosphere returns to the Earth via precipitation or desublimation. Some of this water infiltrates the ground to become groundwater. Seepage, freshwater springs, and plant uptake return some of this water to the surface. The remaining water seeps into the oceans. The remaining surface water enters streams and freshwater lakes, where it eventually enters the ocean via surface runoff. Some water also enters the ocean via underwater vents or volcanoes.
Water from the land and oceans enters the atmosphere by evaporation or sublimation, where it condenses into clouds and falls as rain or snow. Precipitated water may enter freshwater bodies or infiltrate the soil. The cycle is complete when surface or groundwater reenters the ocean. (credit: modification of work by John M. Evans and Howard Perlman, USGS)

The carbon cycle

Carbon is the second most abundant element in living organisms. Carbon is present in all organic molecules, and its role in the structure of macromolecules is of primary importance to living organisms. Carbon compounds contain especially high energy, particularly those derived from fossilized organisms, mainly plants, which humans use as fuel. Since the 1800s, the number of countries using massive amounts of fossil fuels has increased. Since the beginning of the Industrial Revolution, global demand for the Earth’s limited fossil fuel supplies has risen; therefore, the amount of carbon dioxide in our atmosphere has increased. This increase in carbon dioxide has been associated with climate change and other disturbances of the Earth’s ecosystems and is a major environmental concern worldwide. Thus, the “carbon footprint” is based on how much carbon dioxide is produced and how much fossil fuel countries consume.

Questions & Answers

how do you get the 2/50
Abba Reply
number of sport play by 50 student construct discrete data
Aminu Reply
width of the frangebany leaves on how to write a introduction
Theresa Reply
Solve the mean of variance
Veronica Reply
Step 1: Find the mean. To find the mean, add up all the scores, then divide them by the number of scores. ... Step 2: Find each score's deviation from the mean. ... Step 3: Square each deviation from the mean. ... Step 4: Find the sum of squares. ... Step 5: Divide the sum of squares by n – 1 or N.
kenneth
what is error
Yakuba Reply
Is mistake done to something
Vutshila
Hy
anas
hy
What is the life teble
anas
hy
Jibrin
statistics is the analyzing of data
Tajudeen Reply
what is statics?
Zelalem Reply
how do you calculate mean
Gloria Reply
diveving the sum if all values
Shaynaynay
let A1,A2 and A3 events be independent,show that (A1)^c, (A2)^c and (A3)^c are independent?
Fisaye Reply
what is statistics
Akhisani Reply
data collected all over the world
Shaynaynay
construct a less than and more than table
Imad Reply
The sample of 16 students is taken. The average age in the sample was 22 years with astandard deviation of 6 years. Construct a 95% confidence interval for the age of the population.
Aschalew Reply
Bhartdarshan' is an internet-based travel agency wherein customer can see videos of the cities they plant to visit. The number of hits daily is a normally distributed random variable with a mean of 10,000 and a standard deviation of 2,400 a. what is the probability of getting more than 12,000 hits? b. what is the probability of getting fewer than 9,000 hits?
Akshay Reply
Bhartdarshan'is an internet-based travel agency wherein customer can see videos of the cities they plan to visit. The number of hits daily is a normally distributed random variable with a mean of 10,000 and a standard deviation of 2,400. a. What is the probability of getting more than 12,000 hits
Akshay
1
Bright
Sorry i want to learn more about this question
Bright
Someone help
Bright
a= 0.20233 b=0.3384
Sufiyan
a
Shaynaynay
How do I interpret level of significance?
Mohd Reply
It depends on your business problem or in Machine Learning you could use ROC- AUC cruve to decide the threshold value
Shivam
how skewness and kurtosis are used in statistics
Owen Reply
yes what is it
Taneeya
Got questions? Join the online conversation and get instant answers!
Jobilize.com Reply

Get Jobilize Job Search Mobile App in your pocket Now!

Get it on Google Play Download on the App Store Now


Source:  OpenStax, Biology. OpenStax CNX. Feb 29, 2016 Download for free at http://cnx.org/content/col11448/1.10
Google Play and the Google Play logo are trademarks of Google Inc.

Notification Switch

Would you like to follow the 'Biology' conversation and receive update notifications?

Ask