

| << Chapter < Page | Chapter >> Page > |
How are neural signals interpreted? Interpretation of sensory signals between individuals of the same species is largely similar, owing to the inherited similarity of their nervous systems; however, there are some individual differences. A good example of this is individual tolerances to a painful stimulus, such as dental pain, which certainly differ.
Question: What is the smallest detectible weight difference between a one-pound bag of rice and a larger bag? What is the smallest detectible difference between a 20-pound bag and a larger bag? In both cases, at what weights are the differences detected? This smallest detectible difference in stimuli is known as the just-noticeable difference (JND).
Background: Research background literature on JND and on Weber’s Law, a description of a proposed mathematical relationship between the overall magnitude of the stimulus and the JND. You will be testing JND of different weights of rice in bags. Choose a convenient increment that is to be stepped through while testing. For example, you could choose 10 percent increments between one and two pounds (1.1, 1.2, 1.3, 1.4, and so on) or 20 percent increments (1.2, 1.4, 1.6, and 1.8).
Hypothesis: Develop a hypothesis about JND in terms of percentage of the whole weight being tested (such as “the JND between the two small bags and between the two large bags is proportionally the same,” or “. . . is not proportionally the same.”) So, for the first hypothesis, if the JND between the one-pound bag and a larger bag is 0.2 pounds (that is, 20 percent; 1.0 pound feels the same as 1.1 pounds, but 1.0 pound feels less than 1.2 pounds), then the JND between the 20-pound bag and a larger bag will also be 20 percent. (So, 20 pounds feels the same as 22 pounds or 23 pounds, but 20 pounds feels less than 24 pounds.)
Test the hypothesis: Enlist 24 participants, and split them into two groups of 12. To set up the demonstration, assuming a 10 percent increment was selected, have the first group be the one-pound group. As a counter-balancing measure against a systematic error, however, six of the first group will compare one pound to two pounds, and step down in weight (1.0 to 2.0, 1.0 to 1.9, and so on.), while the other six will step up (1.0 to 1.1, 1.0 to 1.2, and so on). Apply the same principle to the 20-pound group (20 to 40, 20 to 38, and so on, and 20 to 22, 20 to 24, and so on). Given the large difference between 20 and 40 pounds, you may wish to use 30 pounds as your larger weight. In any case, use two weights that are easily detectable as different.
Record the observations: Record the data in a table similar to the table below. For the one-pound and 20-pound groups (base weights) record a plus sign (+) for each participant that detects a difference between the base weight and the step weight. Record a minus sign (-) for each participant that finds no difference. If one-tenth steps were not used, then replace the steps in the “Step Weight” columns with the step you are using.
| Results of JND Testing (+ = difference; – = no difference) | |||
|---|---|---|---|
| Step Weight | One pound | 20 pounds | Step Weight |
| 1.1 | 22 | ||
| 1.2 | 24 | ||
| 1.3 | 26 | ||
| 1.4 | 28 | ||
| 1.5 | 30 | ||
| 1.6 | 32 | ||
| 1.7 | 34 | ||
| 1.8 | 36 | ||
| 1.9 | 38 | ||
| 2.0 | 40 |
Analyze the data/report the results: What step weight did all participants find to be equal with one-pound base weight? What about the 20-pound group?
Draw a conclusion: Did the data support the hypothesis? Are the final weights proportionally the same? If not, why not? Do the findings adhere to Weber’s Law? Weber’s Law states that the concept that a just-noticeable difference in a stimulus is proportional to the magnitude of the original stimulus.
A sensory activation occurs when a physical or chemical stimulus is processed into a neural signal (sensory transduction) by a sensory receptor. Perception is an individual interpretation of a sensation and is a brain function. Humans have special senses: olfaction, gustation, equilibrium, and hearing, plus the general senses of somatosensation.
Sensory receptors are either specialized cells associated with sensory neurons or the specialized ends of sensory neurons that are a part of the peripheral nervous system, and they are used to receive information about the environment (internal or external). Each sensory receptor is modified for the type of stimulus it detects. For example, neither gustatory receptors nor auditory receptors are sensitive to light. Each sensory receptor is responsive to stimuli within a specific region in space, which is known as that receptor’s receptive field. The most fundamental function of a sensory system is the translation of a sensory signal to an electrical signal in the nervous system.
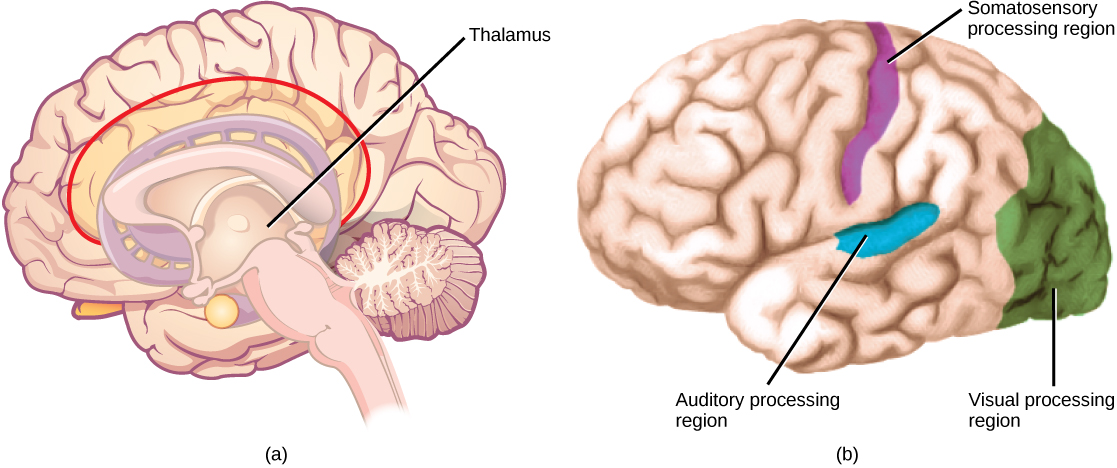
All sensory signals, except those from the olfactory system, enter the central nervous system and are routed to the thalamus. When the sensory signal exits the thalamus, it is conducted to the specific area of the cortex dedicated to processing that particular sense.
Notification Switch
Would you like to follow the 'Biology' conversation and receive update notifications?

|
|

|
|

|
|

|
|

|
|

|
|

|
|

|
|

|
|

|
|

|