<< Chapter < Page Chapter >> Page >

Hardy-weinberg principle of equilibrium

In the early twentieth century, English mathematician Godfrey Hardy and German physician Wilhelm Weinberg stated the principle of equilibrium to describe the genetic makeup of a population. The theory, which later became known as the Hardy-Weinberg principle of equilibrium, states that a population’s allele and genotype frequencies are inherently stable— unless some kind of evolutionary force is acting upon the population, neither the allele nor the genotypic frequencies would change. The Hardy-Weinberg principle assumes conditions with no mutations, migration, emigration, or selective pressure for or against genotype, plus an infinite population; while no population can satisfy those conditions, the principle offers a useful model against which to compare real population changes.

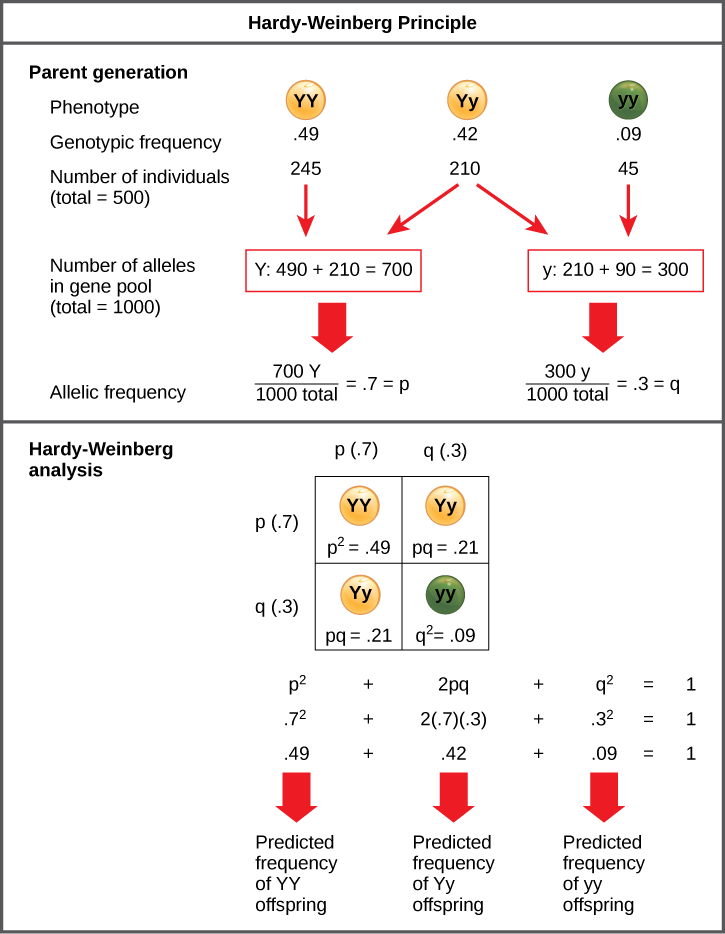
Working under this theory, population geneticists represent different alleles as different variables in their mathematical models. The variable p, for example, often represents the frequency of a particular allele, say Y for the trait of yellow in Mendel’s peas, while the variable q represents the frequency of y alleles that confer the color green. If these are the only two possible alleles for a given locus in the population, p + q = 1. In other words, all the p alleles and all the q alleles make up all of the alleles for that locus that are found in the population.

But what ultimately interests most biologists is not the frequencies of different alleles, but the frequencies of the resulting genotypes, known as the population’s genetic structure    , from which scientists can surmise the distribution of phenotypes. If the phenotype is observed, only the genotype of the homozygous recessive alleles can be known; the calculations provide an estimate of the remaining genotypes. Since each individual carries two alleles per gene, if the allele frequencies (p and q) are known, predicting the frequencies of these genotypes is a simple mathematical calculation to determine the probability of getting these genotypes if two alleles are drawn at random from the gene pool. So in the above scenario, an individual pea plant could be pp (YY), and thus produce yellow peas; pq (Yy), also yellow; or qq (yy), and thus producing green peas ( [link] ). In other words, the frequency of pp individuals is simply p 2 ; the frequency of pq individuals is 2pq; and the frequency of qq individuals is q 2 . And, again, if p and q are the only two possible alleles for a given trait in the population, these genotypes frequencies will sum to one: p 2 + 2pq + q 2 = 1.

Art connection

The Hardy-Weinberg principle is used to predict the genotypic distribution of offspring in a given population. In the example given, pea plants have two different alleles for pea color. The dominant capital Y allele results in yellow pea color, and the recessive small y allele results in green pea color. The distribution of individuals in a population of 500 is given. Of the 500 individuals, 245 are homozygous dominant (capital Y capital Y) and produce yellow peas. 210 are heterozygous (capital Y small y) and also produce yellow peas. 45 are homozygous recessive (small y small y) and produce green peas. The frequencies of homozygous dominant, heterozygous, and homozygous recessive individuals are 0.49, 0.42, and 0.09, respectively.  Each of the 500 individuals provides two alleles to the gene pool, or 1000 total. The 245 homozygous dominant individuals provide two capital Y alleles to the gene pool, or 490 total. The 210 heterozygous individuals provide 210 capital Y and 210 small y alleles to the gene pool. The 45 homozygous recessive individuals provide two small y alleles to the gene pool, or 90 total. The number of capital Y alleles is 490 from homozygous dominant individuals plus 210 from homozygous recessive individuals, or 700 total. The number of small y alleles is 210 from heterozygous individuals plus 90 from homozygous recessive individuals, or 300 total.  The allelic frequency is calculated by dividing the number of each allele by the total number of alleles in the gene pool. For the capital Y allele, the allelic frequency is 700 divided by 1000, or 0.7; this allelic frequency is called p. For the small y allele the allelic frequency is 300 divided by 1000, or 0.3; the allelic frequency is called q.  Hardy-Weinberg analysis is used to determine the genotypic frequency in the offspring. The Hardy-Wienberg equation is p-squared plus 2pq plus q-squared equals 1. For the population given, the frequency is 0.7-squared plus 2 times .7 times .3 plus .3-squared equals one. The value for p-squared, 0.49, is the predicted frequency of homozygous dominant (capital Y capital Y) individuals. The value for 2pq, 0.42, is the predicted frequency of heterozygous (capital Y small y) individuals. The value for q-squared, .09, is the predicted frequency of homozygous recessive individuals. Note that the predicted frequency of genotypes in the offspring is the same as the frequency of genotypes in the parent population. If all the genotypic frequencies, .49 plus .42 plus .09, are added together, the result is one
When populations are in the Hardy-Weinberg equilibrium, the allelic frequency is stable from generation to generation and the distribution of alleles can be determined from the Hardy-Weinberg equation. If the allelic frequency measured in the field differs from the predicted value, scientists can make inferences about what evolutionary forces are at play.

In plants, violet flower color (V) is dominant over white (v). If p = 0.8 and q = 0.2 in a population of 500 plants, how many individuals would you expect to be homozygous dominant (VV), heterozygous (Vv), and homozygous recessive (vv)? How many plants would you expect to have violet flowers, and how many would have white flowers?

In theory, if a population is at equilibrium—that is, there are no evolutionary forces acting upon it—generation after generation would have the same gene pool and genetic structure, and these equations would all hold true all of the time. Of course, even Hardy and Weinberg recognized that no natural population is immune to evolution. Populations in nature are constantly changing in genetic makeup due to drift, mutation, possibly migration, and selection. As a result, the only way to determine the exact distribution of phenotypes in a population is to go out and count them. But the Hardy-Weinberg principle gives scientists a mathematical baseline of a non-evolving population to which they can compare evolving populations and thereby infer what evolutionary forces might be at play. If the frequencies of alleles or genotypes deviate from the value expected from the Hardy-Weinberg equation, then the population is evolving.

Use this online calculator to determine the genetic structure of a population.

Section summary

The modern synthesis of evolutionary theory grew out of the cohesion of Darwin’s, Wallace’s, and Mendel’s thoughts on evolution and heredity, along with the more modern study of population genetics. It describes the evolution of populations and species, from small-scale changes among individuals to large-scale changes over paleontological time periods. To understand how organisms evolve, scientists can track populations’ allele frequencies over time. If they differ from generation to generation, scientists can conclude that the population is not in Hardy-Weinberg equilibrium, and is thus evolving.

Art connections

[link] In plants, violet flower color (V) is dominant over white (v). If p=.8 and q = 0.2 in a population of 500 plants, how many individuals would you expect to be homozygous dominant (VV), heterozygous (Vv), and homozygous recessive (vv)? How many plants would you expect to have violet flowers, and how many would have white flowers?

[link] The expected distribution is 320 VV, 160Vv, and 20 vv plants. Plants with VV or Vv genotypes would have violet flowers, and plants with the vv genotype would have white flowers, so a total of 480 plants would be expected to have violet flowers, and 20 plants would have white flowers.

Got questions? Get instant answers now!

Questions & Answers

A golfer on a fairway is 70 m away from the green, which sits below the level of the fairway by 20 m. If the golfer hits the ball at an angle of 40° with an initial speed of 20 m/s, how close to the green does she come?
Aislinn Reply
cm
tijani
what is titration
John Reply
what is physics
Siyaka Reply
A mouse of mass 200 g falls 100 m down a vertical mine shaft and lands at the bottom with a speed of 8.0 m/s. During its fall, how much work is done on the mouse by air resistance
Jude Reply
Can you compute that for me. Ty
Jude
what is the dimension formula of energy?
David Reply
what is viscosity?
David
what is inorganic
emma Reply
what is chemistry
Youesf Reply
what is inorganic
emma
Chemistry is a branch of science that deals with the study of matter,it composition,it structure and the changes it undergoes
Adjei
please, I'm a physics student and I need help in physics
Adjanou
chemistry could also be understood like the sexual attraction/repulsion of the male and female elements. the reaction varies depending on the energy differences of each given gender. + masculine -female.
Pedro
A ball is thrown straight up.it passes a 2.0m high window 7.50 m off the ground on it path up and takes 1.30 s to go past the window.what was the ball initial velocity
Krampah Reply
2. A sled plus passenger with total mass 50 kg is pulled 20 m across the snow (0.20) at constant velocity by a force directed 25° above the horizontal. Calculate (a) the work of the applied force, (b) the work of friction, and (c) the total work.
Sahid Reply
you have been hired as an espert witness in a court case involving an automobile accident. the accident involved car A of mass 1500kg which crashed into stationary car B of mass 1100kg. the driver of car A applied his brakes 15 m before he skidded and crashed into car B. after the collision, car A s
Samuel Reply
can someone explain to me, an ignorant high school student, why the trend of the graph doesn't follow the fact that the higher frequency a sound wave is, the more power it is, hence, making me think the phons output would follow this general trend?
Joseph Reply
Nevermind i just realied that the graph is the phons output for a person with normal hearing and not just the phons output of the sound waves power, I should read the entire thing next time
Joseph
Follow up question, does anyone know where I can find a graph that accuretly depicts the actual relative "power" output of sound over its frequency instead of just humans hearing
Joseph
"Generation of electrical energy from sound energy | IEEE Conference Publication | IEEE Xplore" ***ieeexplore.ieee.org/document/7150687?reload=true
Ryan
what's motion
Maurice Reply
what are the types of wave
Maurice
answer
Magreth
progressive wave
Magreth
hello friend how are you
Muhammad Reply
fine, how about you?
Mohammed
hi
Mujahid
A string is 3.00 m long with a mass of 5.00 g. The string is held taut with a tension of 500.00 N applied to the string. A pulse is sent down the string. How long does it take the pulse to travel the 3.00 m of the string?
yasuo Reply
Who can show me the full solution in this problem?
Reofrir Reply
Got questions? Join the online conversation and get instant answers!
Jobilize.com Reply

Get Jobilize Job Search Mobile App in your pocket Now!

Get it on Google Play Download on the App Store Now


Source:  OpenStax, Biology. OpenStax CNX. Feb 29, 2016 Download for free at http://cnx.org/content/col11448/1.10
Google Play and the Google Play logo are trademarks of Google Inc.

Notification Switch

Would you like to follow the 'Biology' conversation and receive update notifications?

Ask