<< Chapter < Page Chapter >> Page >

The most primitive living angiosperm is considered to be Amborella trichopoda , a small plant native to the rainforest of New Caledonia, an island in the South Pacific. Analysis of the genome of A. trichopoda has shown that it is related to all existing flowering plants and belongs to the oldest confirmed branch of the angiosperm family tree. A few other angiosperm groups called basal angiosperms, are viewed as primitive because they branched off early from the phylogenetic tree. Most modern angiosperms are classified as either monocots or eudicots, based on the structure of their leaves and embryos. Basal angiosperms, such as water lilies, are considered more primitive because they share morphological traits with both monocots and eudicots.
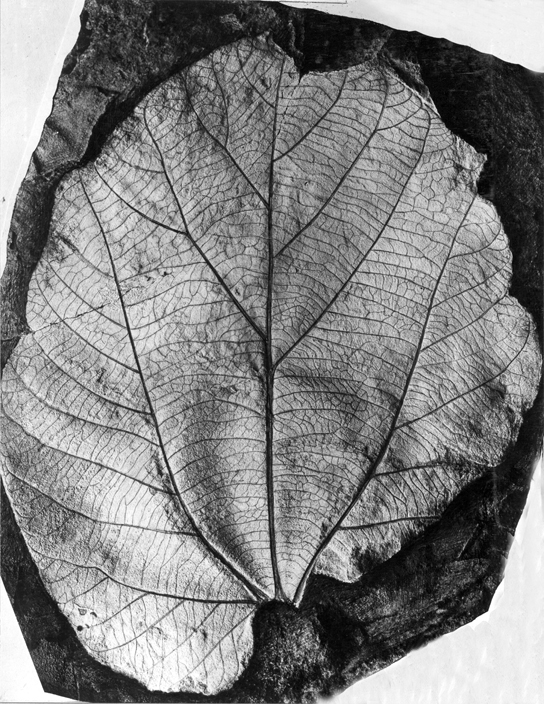
 Photo shows a fossilized leaf, which looks much like a modern teardrop-shaped leaf with multiple, branching veins.
This leaf imprint shows a Ficus speciosissima , an angiosperm that flourished during the Cretaceous period. (credit: W. T. Lee, USGS)

Flowers and fruits as an evolutionary adaptation

Angiosperms produce their gametes in separate organs, which are usually housed in a flower    . Both fertilization and embryo development take place inside an anatomical structure that provides a stable system of sexual reproduction largely sheltered from environmental fluctuations. Flowering plants are the most diverse phylum on Earth after insects; flowers come in a bewildering array of sizes, shapes, colors, smells, and arrangements. Most flowers have a mutualistic pollinator, with the distinctive features of flowers reflecting the nature of the pollination agent. The relationship between pollinator and flower characteristics is one of the great examples of coevolution.

Following fertilization of the egg, the ovule grows into a seed. The surrounding tissues of the ovary thicken, developing into a fruit    that will protect the seed and often ensure its dispersal over a wide geographic range. Not all fruits develop from an ovary; such structures are “false fruits.” Like flowers, fruit can vary tremendously in appearance, size, smell, and taste. Tomatoes, walnut shells and avocados are all examples of fruit. As with pollen and seeds, fruits also act as agents of dispersal. Some may be carried away by the wind. Many attract animals that will eat the fruit and pass the seeds through their digestive systems, then deposit the seeds in another location. Cockleburs are covered with stiff, hooked spines that can hook into fur (or clothing) and hitch a ride on an animal for long distances. The cockleburs that clung to the velvet trousers of an enterprising Swiss hiker, George de Mestral, inspired his invention of the loop and hook fastener he named Velcro.

Evolution connection

Building phylogenetic trees with analysis of dna sequence alignments

All living organisms display patterns of relationships derived from their evolutionary history. Phylogeny is the science that describes the relative connections between organisms, in terms of ancestral and descendant species. Phylogenetic trees, such as the plant evolutionary history shown in [link] , are tree-like branching diagrams that depict these relationships. Species are found at the tips of the branches. Each branching point, called a node, is the point at which a single taxonomic group (taxon), such as a species, separates into two or more species.

This phylogenetic tree shows the evolutionary relationships of plants.

Phylogenetic trees have been built to describe the relationships between species since Darwin’s time. Traditional methods involve comparison of homologous anatomical structures and embryonic development, assuming that closely related organisms share anatomical features during embryo development. Some traits that disappear in the adult are present in the embryo; for example, a human fetus, at one point, has a tail. The study of fossil records shows the intermediate stages that link an ancestral form to its descendants. Most of these approaches are imprecise and lend themselves to multiple interpretations. As the tools of molecular biology and computational analysis have been developed and perfected in recent years, a new generation of tree-building methods has taken shape. The key assumption is that genes for essential proteins or RNA structures, such as the ribosomal RNA, are inherently conserved because mutations (changes in the DNA sequence) could compromise the survival of the organism. DNA from minute amounts of living organisms or fossils can be amplified by polymerase chain reaction (PCR) and sequenced, targeting the regions of the genome that are most likely to be conserved between species. The genes encoding the ribosomal RNA from the small 18S subunit and plastid genes are frequently chosen for DNA alignment analysis.

Once the sequences of interest are obtained, they are compared with existing sequences in databases such as GenBank, which is maintained by The National Center for Biotechnology Information. A number of computational tools are available to align and analyze sequences. Sophisticated computer analysis programs determine the percentage of sequence identity or homology. Sequence homology can be used to estimate the evolutionary distance between two DNA sequences and reflect the time elapsed since the genes separated from a common ancestor. Molecular analysis has revolutionized phylogenetic trees. In some cases, prior results from morphological studies have been confirmed: for example, confirming Amborella trichopoda as the most primitive angiosperm known. However, some groups and relationships have been rearranged as a result of DNA analysis.

Section summary

Seed plants appeared about one million years ago, during the Carboniferous period. Two major innovations—seed and pollen—allowed seed plants to reproduce in the absence of water. The gametophytes of seed plants shrank, while the sporophytes became prominent structures and the diploid stage became the longest phase of the lifecycle. Gymnosperms became the dominant group during the Triassic. In these, pollen grains and seeds protect against desiccation. The seed, unlike a spore, is a diploid embryo surrounded by storage tissue and protective layers. It is equipped to delay germination until growth conditions are optimal. Angiosperms bear both flowers and fruit. The structures protect the gametes and the embryo during its development. Angiosperms appeared during the Mesozoic era and have become the dominant plant life in terrestrial habitats.

Questions & Answers

What are the factors that affect demand for a commodity
Florence Reply
differentiate between demand and supply giving examples
Lambiv Reply
differentiated between demand and supply using examples
Lambiv
what is labour ?
Lambiv
how will I do?
Venny Reply
how is the graph works?I don't fully understand
Rezat Reply
information
Eliyee
devaluation
Eliyee
t
WARKISA
hi guys good evening to all
Lambiv
multiple choice question
Aster Reply
appreciation
Eliyee
explain perfect market
Lindiwe Reply
In economics, a perfect market refers to a theoretical construct where all participants have perfect information, goods are homogenous, there are no barriers to entry or exit, and prices are determined solely by supply and demand. It's an idealized model used for analysis,
Ezea
What is ceteris paribus?
Shukri Reply
other things being equal
AI-Robot
When MP₁ becomes negative, TP start to decline. Extuples Suppose that the short-run production function of certain cut-flower firm is given by: Q=4KL-0.6K2 - 0.112 • Where is quantity of cut flower produced, I is labour input and K is fixed capital input (K-5). Determine the average product of lab
Kelo
Extuples Suppose that the short-run production function of certain cut-flower firm is given by: Q=4KL-0.6K2 - 0.112 • Where is quantity of cut flower produced, I is labour input and K is fixed capital input (K-5). Determine the average product of labour (APL) and marginal product of labour (MPL)
Kelo
yes,thank you
Shukri
Can I ask you other question?
Shukri
what is monopoly mean?
Habtamu Reply
What is different between quantity demand and demand?
Shukri Reply
Quantity demanded refers to the specific amount of a good or service that consumers are willing and able to purchase at a give price and within a specific time period. Demand, on the other hand, is a broader concept that encompasses the entire relationship between price and quantity demanded
Ezea
ok
Shukri
how do you save a country economic situation when it's falling apart
Lilia Reply
what is the difference between economic growth and development
Fiker Reply
Economic growth as an increase in the production and consumption of goods and services within an economy.but Economic development as a broader concept that encompasses not only economic growth but also social & human well being.
Shukri
production function means
Jabir
What do you think is more important to focus on when considering inequality ?
Abdisa Reply
any question about economics?
Awais Reply
sir...I just want to ask one question... Define the term contract curve? if you are free please help me to find this answer 🙏
Asui
it is a curve that we get after connecting the pareto optimal combinations of two consumers after their mutually beneficial trade offs
Awais
thank you so much 👍 sir
Asui
In economics, the contract curve refers to the set of points in an Edgeworth box diagram where both parties involved in a trade cannot be made better off without making one of them worse off. It represents the Pareto efficient allocations of goods between two individuals or entities, where neither p
Cornelius
In economics, the contract curve refers to the set of points in an Edgeworth box diagram where both parties involved in a trade cannot be made better off without making one of them worse off. It represents the Pareto efficient allocations of goods between two individuals or entities,
Cornelius
Suppose a consumer consuming two commodities X and Y has The following utility function u=X0.4 Y0.6. If the price of the X and Y are 2 and 3 respectively and income Constraint is birr 50. A,Calculate quantities of x and y which maximize utility. B,Calculate value of Lagrange multiplier. C,Calculate quantities of X and Y consumed with a given price. D,alculate optimum level of output .
Feyisa Reply
Answer
Feyisa
c
Jabir
the market for lemon has 10 potential consumers, each having an individual demand curve p=101-10Qi, where p is price in dollar's per cup and Qi is the number of cups demanded per week by the i th consumer.Find the market demand curve using algebra. Draw an individual demand curve and the market dema
Gsbwnw Reply
suppose the production function is given by ( L, K)=L¼K¾.assuming capital is fixed find APL and MPL. consider the following short run production function:Q=6L²-0.4L³ a) find the value of L that maximizes output b)find the value of L that maximizes marginal product
Abdureman
Got questions? Join the online conversation and get instant answers!
Jobilize.com Reply

Get Jobilize Job Search Mobile App in your pocket Now!

Get it on Google Play Download on the App Store Now


Source:  OpenStax, Biology. OpenStax CNX. Feb 29, 2016 Download for free at http://cnx.org/content/col11448/1.10
Google Play and the Google Play logo are trademarks of Google Inc.

Notification Switch

Would you like to follow the 'Biology' conversation and receive update notifications?

Ask