| << Chapter < Page | Chapter >> Page > |

Explore an interactive tree of life here. Zoom and click to learn more about the organisms and their evolutionary relationships.
The phylogenetic groupings are continually being debated and refined by evolutionary biologists. Each year, new evidence emerges that further alters the relationships described by a phylogenetic tree diagram.
Watch the following video to learn how biologists use genetic data to determine relationships among organisms.
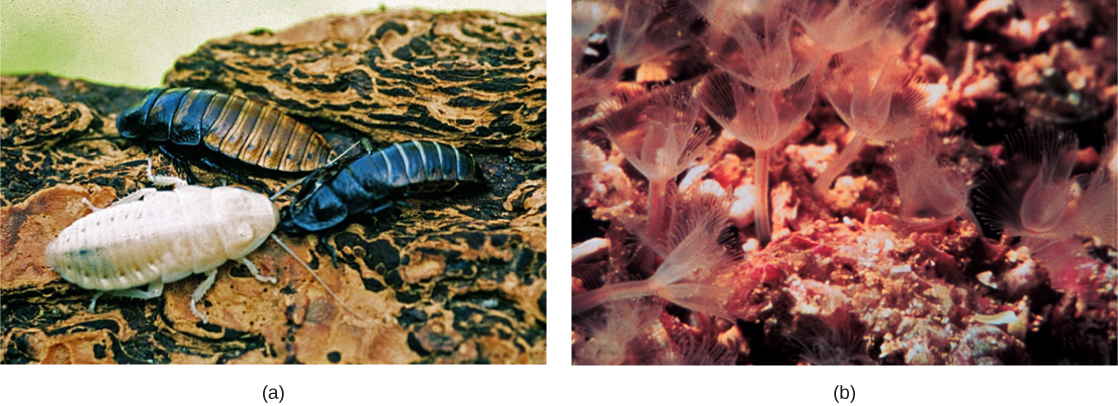
Nucleic acid and protein analyses have greatly informed the modern phylogenetic animal tree. These data come from a variety of molecular sources, such as mitochondrial DNA, nuclear DNA, ribosomal RNA (rRNA), and certain cellular proteins. Many evolutionary relationships in the modern tree have only recently been determined due to molecular evidence. For example, a previously classified group of animals called lophophorates, which included brachiopods and bryozoans, were long-thought to be primitive deuterostomes. Extensive molecular analysis using rRNA data found these animals to be protostomes, more closely related to annelids and mollusks. This discovery allowed for the distinction of the protostome clade, the lophotrochozoans. Molecular data have also shed light on some differences within the lophotrochozoan group, and some scientists believe that the phyla Platyhelminthes and Rotifera within this group should actually belong to their own group of protostomes termed Platyzoa.
Molecular research similar to the discoveries that brought about the distinction of the lophotrochozoan clade has also revealed a dramatic rearrangement of the relationships between mollusks, annelids, arthropods, and nematodes, and a new ecdysozoan clade was formed. Due to morphological similarities in their segmented body types, annelids and arthropods were once thought to be closely related. However, molecular evidence has revealed that arthropods are actually more closely related to nematodes, now comprising the ecdysozoan clade, and annelids are more closely related to mollusks, brachiopods, and other phyla in the lophotrochozoan clade. These two clades now make up the protostomes.
Another change to former phylogenetic groupings because of molecular analyses includes the emergence of an entirely new phylum of worm called Acoelomorpha. These acoel flatworms were long thought to belong to the phylum Platyhelminthes because of their similar “flatworm” morphology. However, molecular analyses revealed this to be a false relationship and originally suggested that acoels represented living species of some of the earliest divergent bilaterians. More recent research into the acoelomorphs has called this hypothesis into question and suggested a closer relationship with deuterostomes. The placement of this new phylum remains disputed, but scientists agree that with sufficient molecular data, their true phylogeny will be determined.
Scientists are interested in the evolutionary history of animals and the evolutionary relationships among them. There are three main sources of data that scientists use to create phylogenetic evolutionary tree diagrams that illustrate such relationships: morphological information (which includes developmental morphologies), fossil record data, and, most recently, molecular data. The details of the modern phylogenetic tree change frequently as new data are gathered, and molecular data has recently contributed to many substantial modifications of the understanding of relationships between animal phyla.

Notification Switch
Would you like to follow the 'Biology' conversation and receive update notifications?