

| << Chapter < Page | Chapter >> Page > |
A variation on incomplete dominance is codominance , in which both alleles for the same characteristic are simultaneously expressed in the heterozygote. An example of codominance is the MN blood groups of humans. The M and N alleles are expressed in the form of an M or N antigen present on the surface of red blood cells. Homozygotes ( L M L M and L N L N ) express either the M or the N allele, and heterozygotes ( L M L N ) express both alleles equally. In a self-cross between heterozygotes expressing a codominant trait, the three possible offspring genotypes are phenotypically distinct. However, the 1:2:1 genotypic ratio characteristic of a Mendelian monohybrid cross still applies.
Mendel implied that only two alleles, one dominant and one recessive, could exist for a given gene. We now know that this is an oversimplification. Although individual humans (and all diploid organisms) can only have two alleles for a given gene, multiple alleles may exist at the population level such that many combinations of two alleles are observed. Note that when many alleles exist for the same gene, the convention is to denote the most common phenotype or genotype among wild animals as the wild type (often abbreviated “+”); this is considered the standard or norm. All other phenotypes or genotypes are considered variants of this standard, meaning that they deviate from the wild type. The variant may be recessive or dominant to the wild-type allele.
An example of multiple alleles is coat color in rabbits ( [link] ). Here, four alleles exist for the c gene. The wild-type version, C + C + , is expressed as brown fur. The chinchilla phenotype, c ch c ch , is expressed as black-tipped white fur. The Himalayan phenotype, c h c h , has black fur on the extremities and white fur elsewhere. Finally, the albino, or “colorless” phenotype, cc , is expressed as white fur. In cases of multiple alleles, dominance hierarchies can exist. In this case, the wild-type allele is dominant over all the others, chinchilla is incompletely dominant over Himalayan and albino, and Himalayan is dominant over albino. This hierarchy, or allelic series, was revealed by observing the phenotypes of each possible heterozygote offspring.
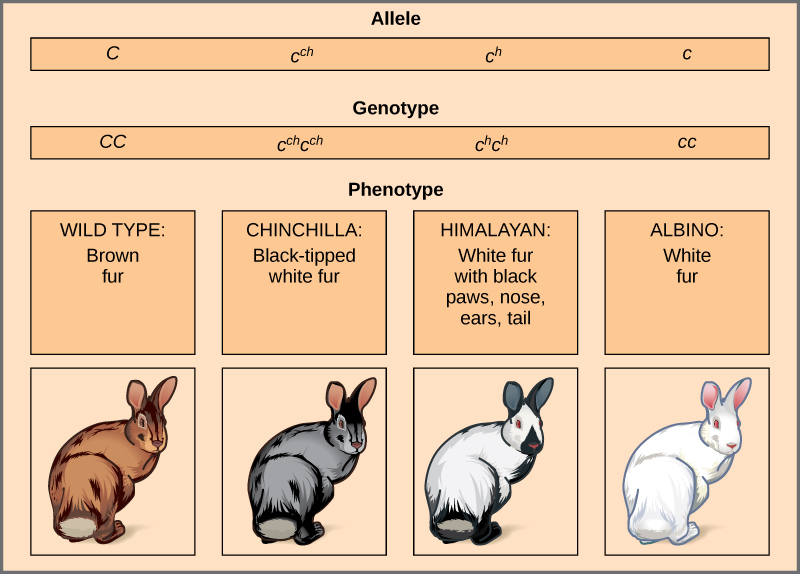
The complete dominance of a wild-type phenotype over all other mutants often occurs as an effect of “dosage” of a specific gene product, such that the wild-type allele supplies the correct amount of gene product whereas the mutant alleles cannot. For the allelic series in rabbits, the wild-type allele may supply a given dosage of fur pigment, whereas the mutants supply a lesser dosage or none at all. Interestingly, the Himalayan phenotype is the result of an allele that produces a temperature-sensitive gene product that only produces pigment in the cooler extremities of the rabbit’s body.
Alternatively, one mutant allele can be dominant over all other phenotypes, including the wild type. This may occur when the mutant allele somehow interferes with the genetic message so that even a heterozygote with one wild-type allele copy expresses the mutant phenotype. One way in which the mutant allele can interfere is by enhancing the function of the wild-type gene product or changing its distribution in the body. One example of this is the Antennapedia mutation in Drosophila ( [link] ). In this case, the mutant allele expands the distribution of the gene product, and as a result, the Antennapedia heterozygote develops legs on its head where its antennae should be.
Notification Switch
Would you like to follow the 'Biology' conversation and receive update notifications?

|
|
|
|
|

|
|

|
|

|
|

|
|

|
|

|
|

|
|
|
|
|

|
|

|