<< Chapter < Page Chapter >> Page >

Art connection

For the four different age structure diagrams shown, the base represents birth and the apex occurs around age 70. The age structure diagram for stage 1, rapid growth, is shaped like a deflated triangle that starts out wide at the base and rapidly decreases to a narrow apex, indicating that the number of individuals decreases rapidly with age. The age structure diagram for stage 2, slow growth, is triangular in shape, indicating that the number of individuals decreases steadily with age. The age structure diagram for stage 3, stable growth, is rounded at the top, indicating that the number of individuals per age group decreases gradually at first, then increases for the older portion of the population. The final age structure diagram, stage 4, widens from the base to middle age, and then narrows to a rounded top. The population type indicated by this diagram is not given, as this is part of the art connection question.
Typical age structure diagrams are shown. The rapid growth diagram narrows to a point, indicating that the number of individuals decreases rapidly with age. In the slow growth model, the number of individuals decreases steadily with age. Stable population diagrams are rounded on the top, showing that the number of individuals per age group decreases gradually, and then increases for the older part of the population.

Age structure diagrams for rapidly growing, slow growing and stable populations are shown in stages 1 through 3. What type of population change do you think stage 4 represents?
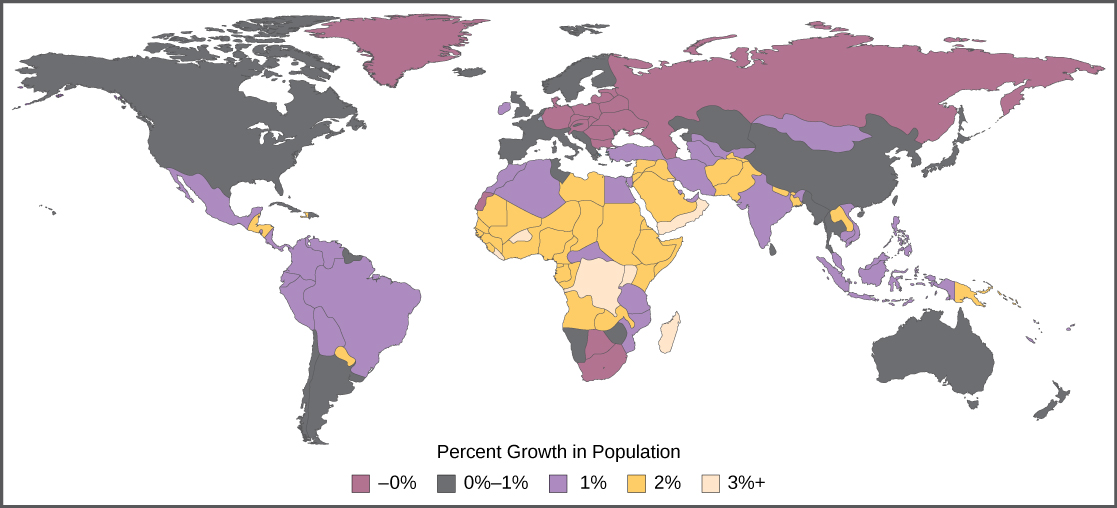
Percent population growth, which ranges from zero percent to three plus percent, is shown on a world map. Europe, Northern Asia, Greenland and South Africa are experiencing zero percent population growth. The United States, Canada, the southern part of South America, China, and Australia are experiencing zero to one percent population growth. Mexico, the northern part of South America, and parts of Africa, the Middle East and Asia are experiencing one percent population growth. Most of Africa and parts of the Middle East and Asia are experiencing two percent population growth. Some parts of Africa are experiencing three percent population growth.
The percent growth rate of population in different countries is shown. Notice that the highest growth is occurring in less economically developed countries in Africa and Asia.

Long-term consequences of exponential human population growth

Many dire predictions have been made about the world’s population leading to a major crisis called the “population explosion.” In the 1968 book The Population Bomb , biologist Dr. Paul R. Ehrlich wrote, “The battle to feed all of humanity is over. In the 1970s hundreds of millions of people will starve to death in spite of any crash programs embarked upon now. At this late date nothing can prevent a substantial increase in the world death rate.” Paul R. Erlich, prologue to The Population Bomb , (1968; repr., New York: Ballantine, 1970). While many critics view this statement as an exaggeration, the laws of exponential population growth are still in effect, and unchecked human population growth cannot continue indefinitely.

Efforts to control population growth led to the one-child policy    in China, which used to include more severe consequences, but now imposes fines on urban couples who have more than one child. Due to the fact that some couples wish to have a male heir, many Chinese couples continue to have more than one child. The policy itself, its social impacts, and the effectiveness of limiting overall population growth are controversial. In spite of population control policies, the human population continues to grow. At some point the food supply may run out because of the subsequent need to produce more and more food to feed our population. The United Nations estimates that future world population growth may vary from 6 billion (a decrease) to 16 billion people by the year 2100. There is no way to know whether human population growth will moderate to the point where the crisis described by Dr. Ehrlich will be averted.

Another result of population growth is the endangerment of the natural environment. Many countries have attempted to reduce the human impact on climate change by reducing their emission of the greenhouse gas carbon dioxide. However, these treaties have not been ratified by every country, and many underdeveloped countries trying to improve their economic condition may be less likely to agree with such provisions if it means slower economic development. Furthermore, the role of human activity in causing climate change has become a hotly debated socio-political issue in some developed countries, including the United States. Thus, we enter the future with considerable uncertainty about our ability to curb human population growth and protect our environment.

Visit this website and select “Launch movie” for an animation discussing the global impacts of human population growth.

Section summary

The world’s human population is growing at an exponential rate. Humans have increased the world’s carrying capacity through migration, agriculture, medical advances, and communication. The age structure of a population allows us to predict population growth. Unchecked human population growth could have dire long-term effects on our environment.

Art connections

[link] Age structure diagrams for rapidly growing, slow growing and stable populations are shown in stages 1 through 3. What type of population change do you think stage 4 represents?

[link] Stage 4 represents a population that is decreasing.

Got questions? Get instant answers now!

Questions & Answers

it is the relatively stable flow of income
Chidubem Reply
what is circular flow of income
Divine Reply
branches of macroeconomics
SHEDRACK Reply
what is Flexible exchang rate?
poudel Reply
is gdp a reliable measurement of wealth
Atega Reply
introduction to econometrics
Husseini Reply
Hi
mostafa
hi
LEMLEM
hello
Sammol
hi
Mahesh
bi
Ruqayat
hi
Ruqayat
Hi fellas
Nyawa
hey
Sammol
hi
God
hello
Jahara
Good morning
Jorge
hi
abubakar
hi
Nmesoma
hi
Mahesh
Hi
Tom
Why is unemployment rate never zero at full employment?
Priyanka Reply
bcoz of existence of frictional unemployment in our economy.
Umashankar
what is flexible exchang rate?
poudel
due to existence of the pple with disabilities
Abdulraufu
the demand of a good rises, causing the demand for another good to fall
Rushawn Reply
is it possible to leave every good at the same level
Joseph
I don't think so. because check it, if the demand for chicken increases, people will no longer consume fish like they used to causing a fall in the demand for fish
Anuolu
is not really possible to let the value of a goods to be same at the same time.....
Salome
Suppose the inflation rate is 6%, does it mean that all the goods you purchase will cost 6% more than previous year? Provide with reasoning.
Geetha Reply
Not necessarily. To measure the inflation rate economists normally use an averaged price index of a basket of certain goods. So if you purchase goods included in the basket, you will notice that you pay 6% more, otherwise not necessarily.
Waeth
discus major problems of macroeconomics
Alii Reply
what is the problem of macroeconomics
Yoal
Economic growth Stable prices and low unemployment
Ephraim
explain inflationcause and itis degre
Miresa Reply
what is inflation
Getu
increase in general price levels
WEETO
Good day How do I calculate this question: C= 100+5yd G= 2000 T= 2000 I(planned)=200. Suppose the actual output is 3000. What is the level of planned expenditures at this level of output?
Chisomo Reply
how to calculate actual output?
Chisomo
how to calculate the equilibrium income
Beshir
Criteria for determining money supply
Thapase Reply
who we can define macroeconomics in one line
Muhammad
Aggregate demand
Mohammed
C=k100 +9y and i=k50.calculate the equilibrium level of output
Mercy Reply
Hi
Isiaka
Hi
Geli
hy
Man
👋
Bahunda
hy how are you?
Man
ys
Amisha
how are you guys
Sekou
f9 guys
Amisha
how are you guys
Sekou
ys am also fine
Amisha
fine and you guys
Geli
from Nepal
Amisha
nawalparasi district from belatari
Amisha
nd u
Amisha
I am Camara from Guinea west Africa... happy to meet you guys here
Sekou
ma management ho
Amisha
ahile becheclor ho
Amisha
hjr ktm bta ho ani k kaam grnu hunxa tw
Amisha
belatari
Amisha
1st year ho
Amisha
nd u
Amisha
ahh
Amisha
kaha biratnagar
Amisha
ys
Amisha
kina k vo
Amisha
money as unit of account means what?
Kalombe
A unit of account is something that can be used to value goods and services and make calculations
Jim
all of you please speak in English I can't understand you're language
Muhammad
I want to know how can we define macroeconomics in one line
Muhammad
it must be .9 or 0.9 no Mpc is greater than 1 Y=100+.9Y+50 Y-.9Y=150 0.1Y/0.1=150/0.1 Y=1500
Kalombe
Mercy is it clear?😋
Kalombe
hi can someone help me on this question If a negative shocks shifts the IS curve to the left, what type of policy do you suggest so as to stabilize the level of output? discuss your answer using appropriate graph.
Galge Reply
if interest rate is increased this will will reduce the level of income shifting the curve to the left ◀️
Kalombe
Got questions? Join the online conversation and get instant answers!
Jobilize.com Reply

Get Jobilize Job Search Mobile App in your pocket Now!

Get it on Google Play Download on the App Store Now


Source:  OpenStax, Biology. OpenStax CNX. Feb 29, 2016 Download for free at http://cnx.org/content/col11448/1.10
Google Play and the Google Play logo are trademarks of Google Inc.

Notification Switch

Would you like to follow the 'Biology' conversation and receive update notifications?

Ask