

| << Chapter < Page | Chapter >> Page > |
Scientists have geological evidence of the consequences of long-ago climate change. Modern-day phenomena such as retreating glaciers and melting polar ice cause a continual rise in sea level. Meanwhile, changes in climate can negatively affect organisms.
Global warming has been associated with at least one planet-wide extinction event during the geological past. The Permian extinction event occurred about 251 million years ago toward the end of the roughly 50-million-year-long geological time span known as the Permian period. This geologic time period was one of the three warmest periods in Earth’s geologic history. Scientists estimate that approximately 70 percent of the terrestrial plant and animal species and 84 percent of marine species became extinct, vanishing forever near the end of the Permian period. Organisms that had adapted to wet and warm climatic conditions, such as annual rainfall of 300–400 cm (118–157 in) and 20 °C–30 °C (68 °F–86 °F) in the tropical wet forest, may not have been able to survive the Permian climate change.
Watch this NASA video to discover the mixed effects of global warming on plant growth. While scientists found that warmer temperatures in the 1980s and 1990s caused an increase in plant productivity, this advantage has since been counteracted by more frequent droughts.
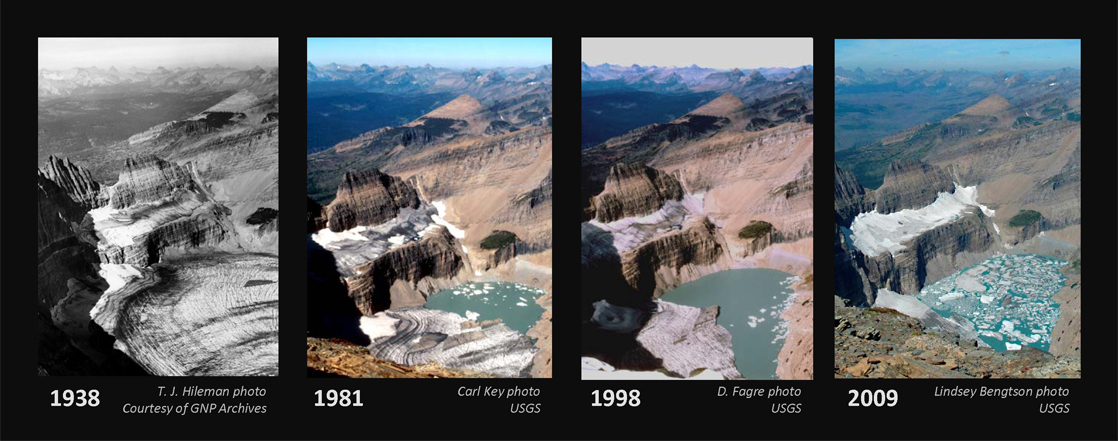
A number of global events have occurred that may be attributed to climate change during our lifetimes. Glacier National Park in Montana is undergoing the retreat of many of its glaciers, a phenomenon known as glacier recession. In 1850, the area contained approximately 150 glaciers. By 2010, however, the park contained only about 24 glaciers greater than 25 acres in size. One of these glaciers is the Grinnell Glacier ( [link] ) at Mount Gould. Between 1966 and 2005, the size of Grinnell Glacier shrank by 40 percent. Similarly, the mass of the ice sheets in Greenland and the Antarctic is decreasing: Greenland lost 150–250 km 3 of ice per year between 2002 and 2006. In addition, the size and thickness of the Arctic sea ice is decreasing.
This loss of ice is leading to increases in the global sea level. On average, the sea is rising at a rate of 1.8 mm per year. However, between 1993 and 2010 the rate of sea level increase ranged between 2.9 and 3.4 mm per year. A variety of factors affect the volume of water in the ocean, including the temperature of the water (the density of water is related to its temperature) and the amount of water found in rivers, lakes, glaciers, polar ice caps, and sea ice. As glaciers and polar ice caps melt, there is a significant contribution of liquid water that was previously frozen.
In addition to some abiotic conditions changing in response to climate change, many organisms are also being affected by the changes in temperature. Temperature and precipitation play key roles in determining the geographic distribution and phenology of plants and animals. (Phenology is the study of the effects of climatic conditions on the timing of periodic lifecycle events, such as flowering in plants or migration in birds.) Researchers have shown that 385 plant species in Great Britain are flowering 4.5 days sooner than was recorded earlier during the previous 40 years. In addition, insect-pollinated species were more likely to flower earlier than wind-pollinated species. The impact of changes in flowering date would be mitigated if the insect pollinators emerged earlier. This mismatched timing of plants and pollinators could result in injurious ecosystem effects because, for continued survival, insect-pollinated plants must flower when their pollinators are present.
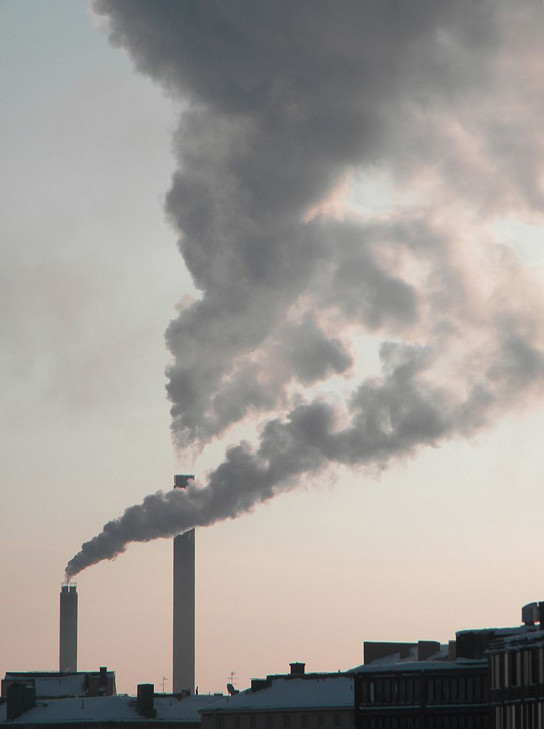
The Earth has gone through periodic cycles of increases and decreases in temperature. During the past 2000 years, the Medieval Climate Anomaly was a warmer period, while the Little Ice Age was unusually cool. Both of these irregularities can be explained by natural causes of changes in climate, and, although the temperature changes were small, they had significant effects. Natural drivers of climate change include Milankovitch cycles, changes in solar activity, and volcanic eruptions. None of these factors, however, leads to rapid increases in global temperature or sustained increases in carbon dioxide. The burning of fossil fuels is an important source of greenhouse gases, which plays a major role in the greenhouse effect. Long ago, global warming resulted in the Permian extinction: a large-scale extinction event that is documented in the fossil record. Currently, modern-day climate change is associated with the increased melting of glaciers and polar ice sheets, resulting in a gradual increase in sea level. Plants and animals can also be affected by global climate change when the timing of seasonal events, such as flowering or pollination, is affected by global warming.
Notification Switch
Would you like to follow the 'Biology' conversation and receive update notifications?

|
|
|
|
|

|
|

|
|

|
|

|
|

|
|

|
|

|
|

|
|

|
|

|