<< Chapter < Page Chapter >> Page >

In science, sometimes things are believed to be true, and then new information comes to light that changes our understanding. The story of the peppered moth is an example: the facts behind the selection toward darker moths have recently been called into question. Read this article to learn more.

Diversifying selection

Sometimes two or more distinct phenotypes can each have their advantages and be selected for by natural selection, while the intermediate phenotypes are, on average, less fit. Known as diversifying selection    ( [link] ), this is seen in many populations of animals that have multiple male forms. Large, dominant alpha males obtain mates by brute force, while small males can sneak in for furtive copulations with the females in an alpha male’s territory. In this case, both the alpha males and the “sneaking” males will be selected for, but medium-sized males, which can’t overtake the alpha males and are too big to sneak copulations, are selected against. Diversifying selection can also occur when environmental changes favor individuals on either end of the phenotypic spectrum. Imagine a population of mice living at the beach where there is light-colored sand interspersed with patches of tall grass. In this scenario, light-colored mice that blend in with the sand would be favored, as well as dark-colored mice that can hide in the grass. Medium-colored mice, on the other hand, would not blend in with either the grass or the sand, and would thus be more likely to be eaten by predators. The result of this type of selection is increased genetic variance as the population becomes more diverse.

Art connection

 Part (a) shows a robin clutch size as an example of stabilizing selection. Robins typically lay four eggs. Larger clutches may result in malnourished chicks, while smaller clutches may result in no viable offspring. A wide bell curve indicates that, in the original population, there was a lot of variability in clutch size. Overlaying this wide bell curve is a narrow one that represents the clutch size after natural selection, which is much less variable. Part (b) shows moth color as an example of directional selection. Light-colored pepper moths are better camouflaged against a pristine environment, while dark-colored peppered moths are better camouflaged against a sooty environment. Thus, as the Industrial Revolution progressed in nineteenth-century England, the color of the moth population shifted from light to dark, an example of directional selection. A bell curve representing the original population and one representing the population after natural selection only slightly overlap. Part (c) shows rabbit coat color as an example of diversifying selection. In this hypothetical example, gray and Himalayan (gray and white) rabbits are better able to blend into their rocky environment than white ones. The original population is represented by a bell curve in which white is the most common coat color, while gray and Himalayan colors, on the right and left flank of the curve, are less common. After natural selection, the bell curve splits into two peaks, indicating gray and Himalayan coat color have become more common than the intermediate white coat color.
Different types of natural selection can impact the distribution of phenotypes within a population. In (a) stabilizing selection, an average phenotype is favored. In (b) directional selection, a change in the environment shifts the spectrum of phenotypes observed. In (c) diversifying selection, two or more extreme phenotypes are selected for, while the average phenotype is selected against.

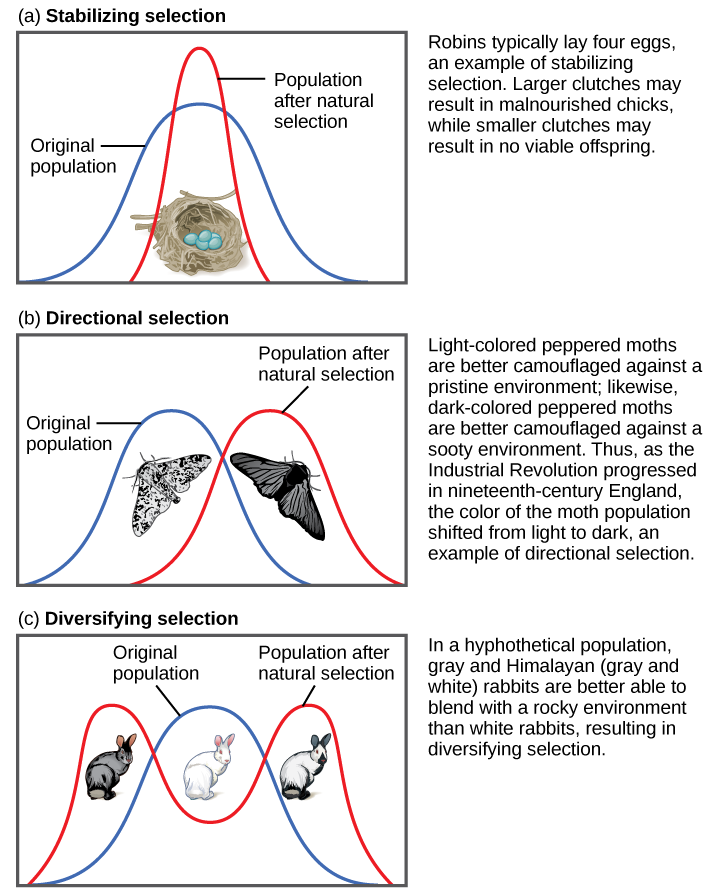
In recent years, factories have become cleaner, and less soot is released into the environment. What impact do you think this has had on the distribution of moth color in the population?

Frequency-dependent selection

Another type of selection, called frequency-dependent selection    , favors phenotypes that are either common (positive frequency-dependent selection) or rare (negative frequency-dependent selection). An interesting example of this type of selection is seen in a unique group of lizards of the Pacific Northwest. Male common side-blotched lizards come in three throat-color patterns: orange, blue, and yellow. Each of these forms has a different reproductive strategy: orange males are the strongest and can fight other males for access to their females; blue males are medium-sized and form strong pair bonds with their mates; and yellow males ( [link] ) are the smallest, and look a bit like females, which allows them to sneak copulations. Like a game of rock-paper-scissors, orange beats blue, blue beats yellow, and yellow beats orange in the competition for females. That is, the big, strong orange males can fight off the blue males to mate with the blue’s pair-bonded females, the blue males are successful at guarding their mates against yellow sneaker males, and the yellow males can sneak copulations from the potential mates of the large, polygynous orange males.

Questions & Answers

how do you get the 2/50
Abba Reply
number of sport play by 50 student construct discrete data
Aminu Reply
width of the frangebany leaves on how to write a introduction
Theresa Reply
Solve the mean of variance
Veronica Reply
Step 1: Find the mean. To find the mean, add up all the scores, then divide them by the number of scores. ... Step 2: Find each score's deviation from the mean. ... Step 3: Square each deviation from the mean. ... Step 4: Find the sum of squares. ... Step 5: Divide the sum of squares by n – 1 or N.
kenneth
what is error
Yakuba Reply
Is mistake done to something
Vutshila
Hy
anas
hy
What is the life teble
anas
hy
Jibrin
statistics is the analyzing of data
Tajudeen Reply
what is statics?
Zelalem Reply
how do you calculate mean
Gloria Reply
diveving the sum if all values
Shaynaynay
let A1,A2 and A3 events be independent,show that (A1)^c, (A2)^c and (A3)^c are independent?
Fisaye Reply
what is statistics
Akhisani Reply
data collected all over the world
Shaynaynay
construct a less than and more than table
Imad Reply
The sample of 16 students is taken. The average age in the sample was 22 years with astandard deviation of 6 years. Construct a 95% confidence interval for the age of the population.
Aschalew Reply
Bhartdarshan' is an internet-based travel agency wherein customer can see videos of the cities they plant to visit. The number of hits daily is a normally distributed random variable with a mean of 10,000 and a standard deviation of 2,400 a. what is the probability of getting more than 12,000 hits? b. what is the probability of getting fewer than 9,000 hits?
Akshay Reply
Bhartdarshan'is an internet-based travel agency wherein customer can see videos of the cities they plan to visit. The number of hits daily is a normally distributed random variable with a mean of 10,000 and a standard deviation of 2,400. a. What is the probability of getting more than 12,000 hits
Akshay
1
Bright
Sorry i want to learn more about this question
Bright
Someone help
Bright
a= 0.20233 b=0.3384
Sufiyan
a
Shaynaynay
How do I interpret level of significance?
Mohd Reply
It depends on your business problem or in Machine Learning you could use ROC- AUC cruve to decide the threshold value
Shivam
how skewness and kurtosis are used in statistics
Owen Reply
yes what is it
Taneeya
Got questions? Join the online conversation and get instant answers!
Jobilize.com Reply

Get Jobilize Job Search Mobile App in your pocket Now!

Get it on Google Play Download on the App Store Now


Source:  OpenStax, Biology. OpenStax CNX. Feb 29, 2016 Download for free at http://cnx.org/content/col11448/1.10
Google Play and the Google Play logo are trademarks of Google Inc.

Notification Switch

Would you like to follow the 'Biology' conversation and receive update notifications?

Ask