<< Chapter < Page Chapter >> Page >
Graph of fecundity as a function of population plots number of eggs per female versus number of worms. The number of eggs decreases rapidly at first, then levels off between 30 to 50 worms.
In this population of roundworms, fecundity (number of eggs) decreases with population density. N.A. Croll et al., “The Population Biology and Control of Ascaris lumbricoides in a Rural Community in Iran.” Transactions of the Royal Society of Tropical Medicine and Hygiene 76, no. 2 (1982): 187-197, doi:10.1016/0035-9203(82)90272-3.

Density-independent regulation and interaction with density-dependent factors

Many factors, typically physical or chemical in nature (abiotic), influence the mortality of a population regardless of its density, including weather, natural disasters, and pollution. An individual deer may be killed in a forest fire regardless of how many deer happen to be in that area. Its chances of survival are the same whether the population density is high or low. The same holds true for cold winter weather.

In real-life situations, population regulation is very complicated and density-dependent and independent factors can interact. A dense population that is reduced in a density-independent manner by some environmental factor(s) will be able to recover differently than a sparse population. For example, a population of deer affected by a harsh winter will recover faster if there are more deer remaining to reproduce.

Evolution connection

Why did the woolly mammoth go extinct?

Photo (a) shows a painting of mammoths walking in the snow. Photo (b) shows a stuffed mammoth sitting in a museum display case. Photo (c) shows a mummified baby mammoth, also in a display case.
The three photos include: (a) 1916 mural of a mammoth herd from the American Museum of Natural History, (b) the only stuffed mammoth in the world, from the Museum of Zoology located in St. Petersburg, Russia, and (c) a one-month-old baby mammoth, named Lyuba, discovered in Siberia in 2007. (credit a: modification of work by Charles R. Knight; credit b: modification of work by “Tanapon”/Flickr; credit c: modification of work by Matt Howry)

It's easy to get lost in the discussion of dinosaurs and theories about why they went extinct 65 million years ago. Was it due to a meteor slamming into Earth near the coast of modern-day Mexico, or was it from some long-term weather cycle that is not yet understood? One hypothesis that will never be proposed is that humans had something to do with it. Mammals were small, insignificant creatures of the forest 65 million years ago, and no humans existed.

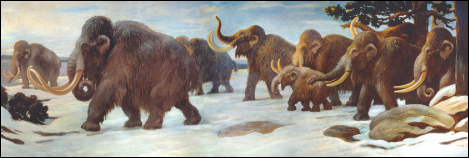
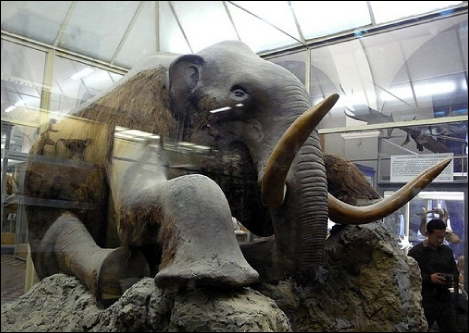
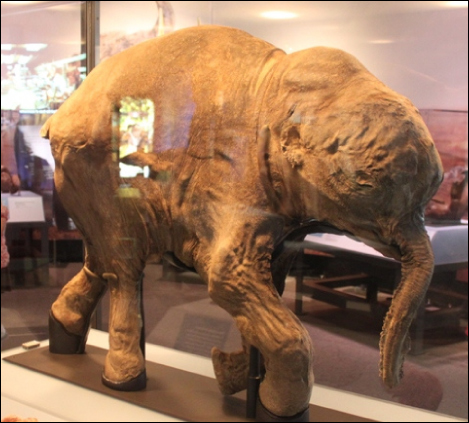
Woolly mammoths, however, began to go extinct about 10,000 years ago, when they shared the Earth with humans who were no different anatomically than humans today ( [link] ). Mammoths survived in isolated island populations as recently as 1700 BC. We know a lot about these animals from carcasses found frozen in the ice of Siberia and other regions of the north. Scientists have sequenced at least 50 percent of its genome and believe mammoths are between 98 and 99 percent identical to modern elephants.

It is commonly thought that climate change and human hunting led to their extinction. A 2008 study estimated that climate change reduced the mammoth’s range from 3,000,000 square miles 42,000 years ago to 310,000 square miles 6,000 years ago. David Nogués-Bravo et al., “Climate Change, Humans, and the Extinction of the Woolly Mammoth.” PLoS Biol 6 (April 2008): e79, doi:10.1371/journal.pbio.0060079. It is also well documented that humans hunted these animals. A 2012 study showed that no single factor was exclusively responsible for the extinction of these magnificent creatures. G.M. MacDonald et al., “Pattern of Extinction of the Woolly Mammoth in Beringia.” Nature Communications 3, no. 893 (June 2012), doi:10.1038/ncomms1881. In addition to human hunting, climate change, and reduction of habitat, these scientists demonstrated another important factor in the mammoth’s extinction was the migration of humans across the Bering Strait to North America during the last ice age 20,000 years ago.

The maintenance of stable populations was and is very complex, with many interacting factors determining the outcome. It is important to remember that humans are also part of nature. Once we contributed to a species’ decline using primitive hunting technology only.

Questions & Answers

how do you get the 2/50
Abba Reply
number of sport play by 50 student construct discrete data
Aminu Reply
width of the frangebany leaves on how to write a introduction
Theresa Reply
Solve the mean of variance
Veronica Reply
Step 1: Find the mean. To find the mean, add up all the scores, then divide them by the number of scores. ... Step 2: Find each score's deviation from the mean. ... Step 3: Square each deviation from the mean. ... Step 4: Find the sum of squares. ... Step 5: Divide the sum of squares by n – 1 or N.
kenneth
what is error
Yakuba Reply
Is mistake done to something
Vutshila
Hy
anas
hy
What is the life teble
anas
hy
Jibrin
statistics is the analyzing of data
Tajudeen Reply
what is statics?
Zelalem Reply
how do you calculate mean
Gloria Reply
diveving the sum if all values
Shaynaynay
let A1,A2 and A3 events be independent,show that (A1)^c, (A2)^c and (A3)^c are independent?
Fisaye Reply
what is statistics
Akhisani Reply
data collected all over the world
Shaynaynay
construct a less than and more than table
Imad Reply
The sample of 16 students is taken. The average age in the sample was 22 years with astandard deviation of 6 years. Construct a 95% confidence interval for the age of the population.
Aschalew Reply
Bhartdarshan' is an internet-based travel agency wherein customer can see videos of the cities they plant to visit. The number of hits daily is a normally distributed random variable with a mean of 10,000 and a standard deviation of 2,400 a. what is the probability of getting more than 12,000 hits? b. what is the probability of getting fewer than 9,000 hits?
Akshay Reply
Bhartdarshan'is an internet-based travel agency wherein customer can see videos of the cities they plan to visit. The number of hits daily is a normally distributed random variable with a mean of 10,000 and a standard deviation of 2,400. a. What is the probability of getting more than 12,000 hits
Akshay
1
Bright
Sorry i want to learn more about this question
Bright
Someone help
Bright
a= 0.20233 b=0.3384
Sufiyan
a
Shaynaynay
How do I interpret level of significance?
Mohd Reply
It depends on your business problem or in Machine Learning you could use ROC- AUC cruve to decide the threshold value
Shivam
how skewness and kurtosis are used in statistics
Owen Reply
yes what is it
Taneeya
Got questions? Join the online conversation and get instant answers!
Jobilize.com Reply

Get Jobilize Job Search Mobile App in your pocket Now!

Get it on Google Play Download on the App Store Now


Source:  OpenStax, Biology. OpenStax CNX. Feb 29, 2016 Download for free at http://cnx.org/content/col11448/1.10
Google Play and the Google Play logo are trademarks of Google Inc.

Notification Switch

Would you like to follow the 'Biology' conversation and receive update notifications?

Ask