

| << Chapter < Page | Chapter >> Page > |
Visit this interactive site to guess which bones structures are homologous and which are analogous, and see examples of evolutionary adaptations to illustrate these concepts.
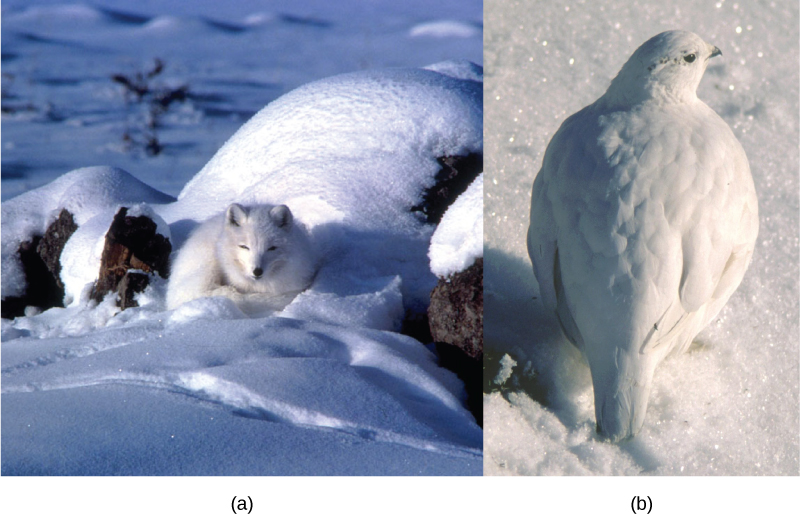
Another evidence of evolution is the convergence of form in organisms that share similar environments. For example, species of unrelated animals, such as the arctic fox and ptarmigan, living in the arctic region have been selected for seasonal white phenotypes during winter to blend with the snow and ice ( [link] ab ). These similarities occur not because of common ancestry, but because of similar selection pressures—the benefits of not being seen by predators.
Embryology, the study of the development of the anatomy of an organism to its adult form, also provides evidence of relatedness between now widely divergent groups of organisms. Mutational tweaking in the embryo can have such magnified consequences in the adult that embryo formation tends to be conserved. As a result, structures that are absent in some groups often appear in their embryonic forms and disappear by the time the adult or juvenile form is reached. For example, all vertebrate embryos, including humans, exhibit gill slits and tails at some point in their early development. These disappear in the adults of terrestrial groups but are maintained in adult forms of aquatic groups such as fish and some amphibians. Great ape embryos, including humans, have a tail structure during their development that is lost by the time of birth.
The geographic distribution of organisms on the planet follows patterns that are best explained by evolution in conjunction with the movement of tectonic plates over geological time. Broad groups that evolved before the breakup of the supercontinent Pangaea (about 200 million years ago) are distributed worldwide. Groups that evolved since the breakup appear uniquely in regions of the planet, such as the unique flora and fauna of northern continents that formed from the supercontinent Laurasia and of the southern continents that formed from the supercontinent Gondwana. The presence of members of the plant family Proteaceae in Australia, southern Africa, and South America is best by their presence prior to the southern supercontinent Gondwana breaking up.
The great diversification of marsupials in Australia and the absence of other mammals reflect Australia’s long isolation. Australia has an abundance of endemic species—species found nowhere else—which is typical of islands whose isolation by expanses of water prevents species to migrate. Over time, these species diverge evolutionarily into new species that look very different from their ancestors that may exist on the mainland. The marsupials of Australia, the finches on the Galápagos, and many species on the Hawaiian Islands are all unique to their one point of origin, yet they display distant relationships to ancestral species on mainlands.
Notification Switch
Would you like to follow the 'Biology' conversation and receive update notifications?

|
|
|
|
|

|
|

|
|

|
|

|
|
|
|
|
|
|

|
|

|
|

|
|

|