<< Chapter < Page Chapter >> Page >
Part a: This illustration shows cytokinesis in a typical animal cell. Part b: Cytokinesis is shown in a typical plant cell. In an animal cell, a contractile ring of actin filaments forms a cleavage furrow that divides the cell in two. In a plant cell, Golgi vesicles coalesce at the metaphase plate. A cell plate grows from the center outward, and the vesicles form a plasma membrane that divides the cytoplasm.
During cytokinesis in animal cells, a ring of actin filaments forms at the metaphase plate. The ring contracts, forming a cleavage furrow, which divides the cell in two. In plant cells, Golgi vesicles coalesce at the former metaphase plate, forming a phragmoplast. A cell plate formed by the fusion of the vesicles of the phragmoplast grows from the center toward the cell walls, and the membranes of the vesicles fuse to form a plasma membrane that divides the cell in two.

G 0 Phase

Not all cells adhere to the classic cell cycle pattern in which a newly formed daughter cell immediately enters the preparatory phases of interphase, closely followed by the mitotic phase. Cells in G 0 phase    are not actively preparing to divide. The cell is in a quiescent    (inactive) stage that occurs when cells exit the cell cycle. Some cells enter G 0 temporarily until an external signal triggers the onset of G 1 . Other cells that never or rarely divide, such as mature cardiac muscle and nerve cells, remain in G 0 permanently.

Scientific method connection

Determine the time spent in cell cycle stages

Problem : How long does a cell spend in interphase compared to each stage of mitosis?

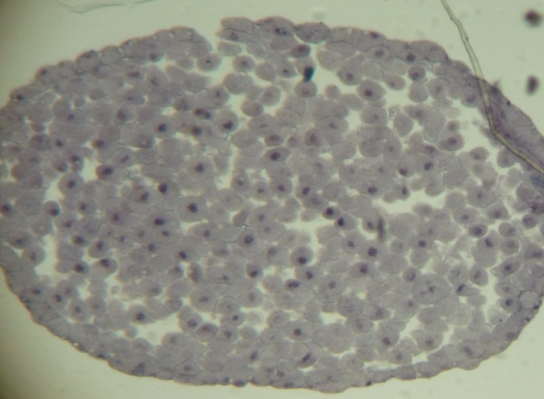
Background : A prepared microscope slide of blastula cross-sections will show cells arrested in various stages of the cell cycle. It is not visually possible to separate the stages of interphase from each other, but the mitotic stages are readily identifiable. If 100 cells are examined, the number of cells in each identifiable cell cycle stage will give an estimate of the time it takes for the cell to complete that stage.

Problem Statement : Given the events included in all of interphase and those that take place in each stage of mitosis, estimate the length of each stage based on a 24-hour cell cycle. Before proceeding, state your hypothesis.

Test your hypothesis : Test your hypothesis by doing the following:

  1. Place a fixed and stained microscope slide of whitefish blastula cross-sections under the scanning objective of a light microscope.
  2. Locate and focus on one of the sections using the scanning objective of your microscope. Notice that the section is a circle composed of dozens of closely packed individual cells.
  3. Switch to the low-power objective and refocus. With this objective, individual cells are visible.
  4. Switch to the high-power objective and slowly move the slide left to right, and up and down to view all the cells in the section ( [link] ). As you scan, you will notice that most of the cells are not undergoing mitosis but are in the interphase period of the cell cycle.

    Left: This figure shows an illustration of whitefish blastula cells with a scanning pattern from right to left, and from top to bottom. Right: A micrograph of whitefish blastula cells in various phases of the cell cycle is shown.
    Slowly scan whitefish blastula cells with the high-power objective as illustrated in image (a) to identify their mitotic stage. (b) A microscopic image of the scanned cells is shown. (credit “micrograph”: modification of work by Linda Flora; scale-bar data from Matt Russell)

  5. Practice identifying the various stages of the cell cycle, using the drawings of the stages as a guide ( [link] ).
  6. Once you are confident about your identification, begin to record the stage of each cell you encounter as you scan left to right, and top to bottom across the blastula section.
  7. Keep a tally of your observations and stop when you reach 100 cells identified.
  8. The larger the sample size (total number of cells counted), the more accurate the results. If possible, gather and record group data prior to calculating percentages and making estimates.

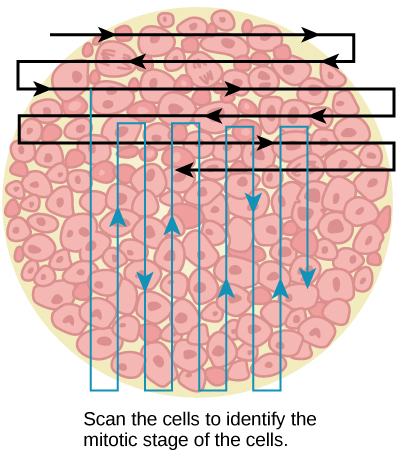
Record your observations : Make a table similar to [link] in which you record your observations.

Results of Cell Stage Identification
Phase or Stage Individual Totals Group Totals Percent
Interphase
Prophase
Metaphase
Anaphase
Telophase
Cytokinesis
Totals 100 100 100 percent

Analyze your data/report your results : To find the length of time whitefish blastula cells spend in each stage, multiply the percent (recorded as a decimal) by 24 hours. Make a table similar to [link] to illustrate your data.

Estimate of Cell Stage Length
Phase or Stage Percent (as Decimal) Time in Hours
Interphase
Prophase
Metaphase
Anaphase
Telophase
Cytokinesis

Draw a conclusion : Did your results support your estimated times? Were any of the outcomes unexpected? If so, discuss which events in that stage might contribute to the calculated time.

Section summary

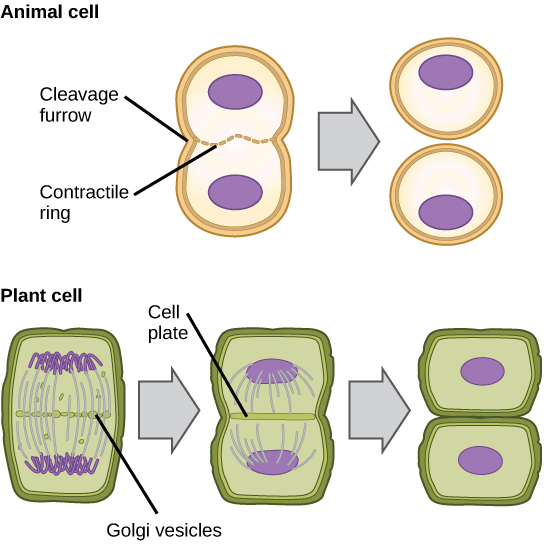
The cell cycle is an orderly sequence of events. Cells on the path to cell division proceed through a series of precisely timed and carefully regulated stages. In eukaryotes, the cell cycle consists of a long preparatory period, called interphase. Interphase is divided into G 1 , S, and G 2 phases. The mitotic phase begins with karyokinesis (mitosis), which consists of five stages: prophase, prometaphase, metaphase, anaphase, and telophase. The final stage of the mitotic phase is cytokinesis, during which the cytoplasmic components of the daughter cells are separated either by an actin ring (animal cells) or by cell plate formation (plant cells).

Art connections

[link] Which of the following is the correct order of events in mitosis?

  1. Sister chromatids line up at the metaphase plate. The kinetochore becomes attached to the mitotic spindle. The nucleus reforms and the cell divides. Cohesin proteins break down and the sister chromatids separate.
  2. The kinetochore becomes attached to the mitotic spindle. Cohesin proteins break down and the sister chromatids separate. Sister chromatids line up at the metaphase plate. The nucleus reforms and the cell divides.
  3. The kinetochore becomes attached to the cohesin proteins. Sister chromatids line up at the metaphase plate. The kinetochore breaks down and the sister chromatids separate. The nucleus reforms and the cell divides.
  4. The kinetochore becomes attached to the mitotic spindle. Sister chromatids line up at the metaphase plate. Cohesin proteins break down and the sister chromatids separate. The nucleus reforms and the cell divides.

[link] D. The kinetochore becomes attached to the mitotic spindle. Sister chromatids line up at the metaphase plate. Cohesin proteins break down and the sister chromatids separate. The nucleus reforms and the cell divides.

Got questions? Get instant answers now!

Questions & Answers

differentiate between demand and supply giving examples
Lambiv Reply
differentiated between demand and supply using examples
Lambiv
what is labour ?
Lambiv
how will I do?
Venny Reply
how is the graph works?I don't fully understand
Rezat Reply
information
Eliyee
devaluation
Eliyee
t
WARKISA
hi guys good evening to all
Lambiv
multiple choice question
Aster Reply
appreciation
Eliyee
explain perfect market
Lindiwe Reply
In economics, a perfect market refers to a theoretical construct where all participants have perfect information, goods are homogenous, there are no barriers to entry or exit, and prices are determined solely by supply and demand. It's an idealized model used for analysis,
Ezea
What is ceteris paribus?
Shukri Reply
other things being equal
AI-Robot
When MP₁ becomes negative, TP start to decline. Extuples Suppose that the short-run production function of certain cut-flower firm is given by: Q=4KL-0.6K2 - 0.112 • Where is quantity of cut flower produced, I is labour input and K is fixed capital input (K-5). Determine the average product of lab
Kelo
Extuples Suppose that the short-run production function of certain cut-flower firm is given by: Q=4KL-0.6K2 - 0.112 • Where is quantity of cut flower produced, I is labour input and K is fixed capital input (K-5). Determine the average product of labour (APL) and marginal product of labour (MPL)
Kelo
yes,thank you
Shukri
Can I ask you other question?
Shukri
what is monopoly mean?
Habtamu Reply
What is different between quantity demand and demand?
Shukri Reply
Quantity demanded refers to the specific amount of a good or service that consumers are willing and able to purchase at a give price and within a specific time period. Demand, on the other hand, is a broader concept that encompasses the entire relationship between price and quantity demanded
Ezea
ok
Shukri
how do you save a country economic situation when it's falling apart
Lilia Reply
what is the difference between economic growth and development
Fiker Reply
Economic growth as an increase in the production and consumption of goods and services within an economy.but Economic development as a broader concept that encompasses not only economic growth but also social & human well being.
Shukri
production function means
Jabir
What do you think is more important to focus on when considering inequality ?
Abdisa Reply
any question about economics?
Awais Reply
sir...I just want to ask one question... Define the term contract curve? if you are free please help me to find this answer 🙏
Asui
it is a curve that we get after connecting the pareto optimal combinations of two consumers after their mutually beneficial trade offs
Awais
thank you so much 👍 sir
Asui
In economics, the contract curve refers to the set of points in an Edgeworth box diagram where both parties involved in a trade cannot be made better off without making one of them worse off. It represents the Pareto efficient allocations of goods between two individuals or entities, where neither p
Cornelius
In economics, the contract curve refers to the set of points in an Edgeworth box diagram where both parties involved in a trade cannot be made better off without making one of them worse off. It represents the Pareto efficient allocations of goods between two individuals or entities,
Cornelius
Suppose a consumer consuming two commodities X and Y has The following utility function u=X0.4 Y0.6. If the price of the X and Y are 2 and 3 respectively and income Constraint is birr 50. A,Calculate quantities of x and y which maximize utility. B,Calculate value of Lagrange multiplier. C,Calculate quantities of X and Y consumed with a given price. D,alculate optimum level of output .
Feyisa Reply
Answer
Feyisa
c
Jabir
the market for lemon has 10 potential consumers, each having an individual demand curve p=101-10Qi, where p is price in dollar's per cup and Qi is the number of cups demanded per week by the i th consumer.Find the market demand curve using algebra. Draw an individual demand curve and the market dema
Gsbwnw Reply
suppose the production function is given by ( L, K)=L¼K¾.assuming capital is fixed find APL and MPL. consider the following short run production function:Q=6L²-0.4L³ a) find the value of L that maximizes output b)find the value of L that maximizes marginal product
Abdureman
types of unemployment
Yomi Reply
What is the difference between perfect competition and monopolistic competition?
Mohammed
Got questions? Join the online conversation and get instant answers!
Jobilize.com Reply

Get Jobilize Job Search Mobile App in your pocket Now!

Get it on Google Play Download on the App Store Now


Source:  OpenStax, Biology. OpenStax CNX. Feb 29, 2016 Download for free at http://cnx.org/content/col11448/1.10
Google Play and the Google Play logo are trademarks of Google Inc.

Notification Switch

Would you like to follow the 'Biology' conversation and receive update notifications?

Ask