<< Chapter < Page Chapter >> Page >
By the end of this section, you will be able to:
  • Identify significant threats to biodiversity
  • Explain the effects of habitat loss, exotic species, and hunting on biodiversity
  • Identify the early and predicted effects of climate change on biodiversity

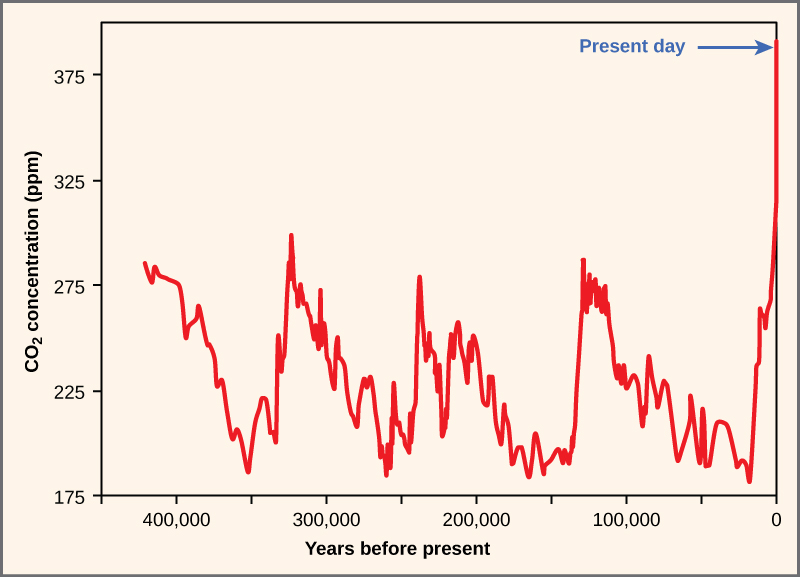
The core threat to biodiversity on the planet, and therefore a threat to human welfare, is the combination of human population growth and resource exploitation. The human population requires resources to survive and grow, and those resources are being removed unsustainably from the environment. The three greatest proximate threats to biodiversity are habitat loss, overharvesting, and introduction of exotic species. The first two of these are a direct result of human population growth and resource use. The third results from increased mobility and trade. A fourth major cause of extinction, anthropogenic climate change, has not yet had a large impact, but it is predicted to become significant during this century. Global climate change is also a consequence of human population needs for energy and the use of fossil fuels to meet those needs ( [link] ). Environmental issues, such as toxic pollution, have specific targeted effects on species, but they are not generally seen as threats at the magnitude of the others.

 The graph plots atmospheric carbon dioxide concentration in parts per million over time (years before present). Historically, carbon dioxide levels have fluctuated in a cyclical manner, from about 280 parts per million at the peak to about 180 parts per million at the low point. This cycle repeated every one hundred thousand years or so, from about 425,000 years ago until recently. Prior to the industrial revolution, the atmospheric carbon dioxide concentration was at a low point in the cycle. Since then the carbon dioxide level has rapidly climbed to its current level of 395 parts per million. This carbon dioxide level is far higher than any previously recorded levels.
Atmospheric carbon dioxide levels fluctuate in a cyclical manner. However, the burning of fossil fuels in recent history has caused a dramatic increase in the levels of carbon dioxide in the Earth’s atmosphere, which have now reached levels never before seen in human history. Scientists predict that the addition of this “greenhouse gas” to the atmosphere is resulting in climate change that will significantly impact biodiversity in the coming century.

Habitat loss

Humans rely on technology to modify their environment and replace certain functions that were once performed by the natural ecosystem. Other species cannot do this. Elimination of their ecosystem—whether it is a forest, a desert, a grassland, a freshwater estuarine, or a marine environment—will kill the individuals in the species. Remove the entire habitat within the range of a species and, unless they are one of the few species that do well in human-built environments, the species will become extinct. Human destruction of habitats accelerated in the latter half of the twentieth century. Consider the exceptional biodiversity of Sumatra: it is home to one species of orangutan, a species of critically endangered elephant, and the Sumatran tiger, but half of Sumatra’s forest is now gone. The neighboring island of Borneo, home to the other species of orangutan, has lost a similar area of forest. Forest loss continues in protected areas of Borneo. The orangutan in Borneo is listed as endangered by the International Union for Conservation of Nature (IUCN), but it is simply the most visible of thousands of species that will not survive the disappearance of the forests of Borneo. The forests are removed for timber and to plant palm oil plantations ( [link] ). Palm oil is used in many products including food products, cosmetics, and biodiesel in Europe. A five-year estimate of global forest cover loss for the years 2000–2005 was 3.1 percent. In the humid tropics where forest loss is primarily from timber extraction, 272,000 km 2 was lost out of a global total of 11,564,000 km 2 (or 2.4 percent). In the tropics, these losses certainly also represent the extinction of species because of high levels of endemism.

Questions & Answers

how do you get the 2/50
Abba Reply
number of sport play by 50 student construct discrete data
Aminu Reply
width of the frangebany leaves on how to write a introduction
Theresa Reply
Solve the mean of variance
Veronica Reply
Step 1: Find the mean. To find the mean, add up all the scores, then divide them by the number of scores. ... Step 2: Find each score's deviation from the mean. ... Step 3: Square each deviation from the mean. ... Step 4: Find the sum of squares. ... Step 5: Divide the sum of squares by n – 1 or N.
kenneth
what is error
Yakuba Reply
Is mistake done to something
Vutshila
Hy
anas
hy
What is the life teble
anas
hy
Jibrin
statistics is the analyzing of data
Tajudeen Reply
what is statics?
Zelalem Reply
how do you calculate mean
Gloria Reply
diveving the sum if all values
Shaynaynay
let A1,A2 and A3 events be independent,show that (A1)^c, (A2)^c and (A3)^c are independent?
Fisaye Reply
what is statistics
Akhisani Reply
data collected all over the world
Shaynaynay
construct a less than and more than table
Imad Reply
The sample of 16 students is taken. The average age in the sample was 22 years with astandard deviation of 6 years. Construct a 95% confidence interval for the age of the population.
Aschalew Reply
Bhartdarshan' is an internet-based travel agency wherein customer can see videos of the cities they plant to visit. The number of hits daily is a normally distributed random variable with a mean of 10,000 and a standard deviation of 2,400 a. what is the probability of getting more than 12,000 hits? b. what is the probability of getting fewer than 9,000 hits?
Akshay Reply
Bhartdarshan'is an internet-based travel agency wherein customer can see videos of the cities they plan to visit. The number of hits daily is a normally distributed random variable with a mean of 10,000 and a standard deviation of 2,400. a. What is the probability of getting more than 12,000 hits
Akshay
1
Bright
Sorry i want to learn more about this question
Bright
Someone help
Bright
a= 0.20233 b=0.3384
Sufiyan
a
Shaynaynay
How do I interpret level of significance?
Mohd Reply
It depends on your business problem or in Machine Learning you could use ROC- AUC cruve to decide the threshold value
Shivam
how skewness and kurtosis are used in statistics
Owen Reply
yes what is it
Taneeya
Got questions? Join the online conversation and get instant answers!
Jobilize.com Reply

Get Jobilize Job Search Mobile App in your pocket Now!

Get it on Google Play Download on the App Store Now


Source:  OpenStax, Biology. OpenStax CNX. Feb 29, 2016 Download for free at http://cnx.org/content/col11448/1.10
Google Play and the Google Play logo are trademarks of Google Inc.

Notification Switch

Would you like to follow the 'Biology' conversation and receive update notifications?

Ask