<< Chapter < Page Chapter >> Page >
By the end of this section, you will be able to:
  • Discuss Sutton’s Chromosomal Theory of Inheritance
  • Describe genetic linkage
  • Explain the process of homologous recombination, or crossing over
  • Describe how chromosome maps are created
  • Calculate the distances between three genes on a chromosome using a three-point test cross

Long before chromosomes were visualized under a microscope, the father of modern genetics, Gregor Mendel, began studying heredity in 1843. With the improvement of microscopic techniques during the late 1800s, cell biologists could stain and visualize subcellular structures with dyes and observe their actions during cell division and meiosis. With each mitotic division, chromosomes replicated, condensed from an amorphous (no constant shape) nuclear mass into distinct X-shaped bodies (pairs of identical sister chromatids), and migrated to separate cellular poles.

Chromosomal theory of inheritance

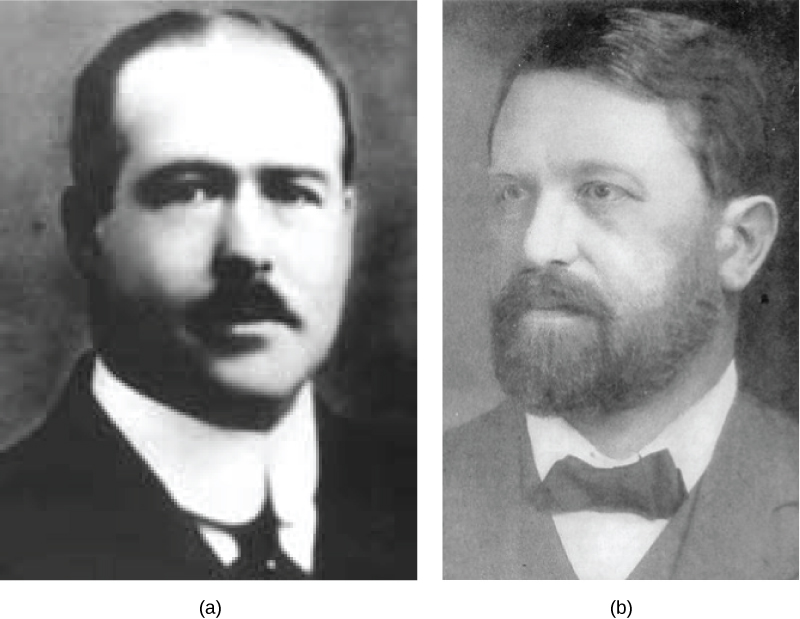
The speculation that chromosomes might be the key to understanding heredity led several scientists to examine Mendel’s publications and re-evaluate his model in terms of the behavior of chromosomes during mitosis and meiosis. In 1902, Theodor Boveri observed that proper embryonic development of sea urchins does not occur unless chromosomes are present. That same year, Walter Sutton observed the separation of chromosomes into daughter cells during meiosis ( [link] ). Together, these observations led to the development of the Chromosomal Theory of Inheritance    , which identified chromosomes as the genetic material responsible for Mendelian inheritance.

Part a is a photo of Walter Sutton. Part b is a photo of Theodor Boveri.
(a) Walter Sutton and (b) Theodor Boveri are credited with developing the Chromosomal Theory of Inheritance, which states that chromosomes carry the unit of heredity (genes).

The Chromosomal Theory of Inheritance was consistent with Mendel’s laws and was supported by the following observations:

  • During meiosis, homologous chromosome pairs migrate as discrete structures that are independent of other chromosome pairs.
  • The sorting of chromosomes from each homologous pair into pre-gametes appears to be random.
  • Each parent synthesizes gametes that contain only half of their chromosomal complement.
  • Even though male and female gametes (sperm and egg) differ in size and morphology, they have the same number of chromosomes, suggesting equal genetic contributions from each parent.
  • The gametic chromosomes combine during fertilization to produce offspring with the same chromosome number as their parents.

Despite compelling correlations between the behavior of chromosomes during meiosis and Mendel’s abstract laws, the Chromosomal Theory of Inheritance was proposed long before there was any direct evidence that traits were carried on chromosomes. Critics pointed out that individuals had far more independently segregating traits than they had chromosomes. It was only after several years of carrying out crosses with the fruit fly, Drosophila melanogaster , that Thomas Hunt Morgan provided experimental evidence to support the Chromosomal Theory of Inheritance.

Questions & Answers

differentiate between demand and supply giving examples
Lambiv Reply
differentiated between demand and supply using examples
Lambiv
what is labour ?
Lambiv
how will I do?
Venny Reply
how is the graph works?I don't fully understand
Rezat Reply
information
Eliyee
devaluation
Eliyee
t
WARKISA
hi guys good evening to all
Lambiv
multiple choice question
Aster Reply
appreciation
Eliyee
explain perfect market
Lindiwe Reply
In economics, a perfect market refers to a theoretical construct where all participants have perfect information, goods are homogenous, there are no barriers to entry or exit, and prices are determined solely by supply and demand. It's an idealized model used for analysis,
Ezea
What is ceteris paribus?
Shukri Reply
other things being equal
AI-Robot
When MP₁ becomes negative, TP start to decline. Extuples Suppose that the short-run production function of certain cut-flower firm is given by: Q=4KL-0.6K2 - 0.112 • Where is quantity of cut flower produced, I is labour input and K is fixed capital input (K-5). Determine the average product of lab
Kelo
Extuples Suppose that the short-run production function of certain cut-flower firm is given by: Q=4KL-0.6K2 - 0.112 • Where is quantity of cut flower produced, I is labour input and K is fixed capital input (K-5). Determine the average product of labour (APL) and marginal product of labour (MPL)
Kelo
yes,thank you
Shukri
Can I ask you other question?
Shukri
what is monopoly mean?
Habtamu Reply
What is different between quantity demand and demand?
Shukri Reply
Quantity demanded refers to the specific amount of a good or service that consumers are willing and able to purchase at a give price and within a specific time period. Demand, on the other hand, is a broader concept that encompasses the entire relationship between price and quantity demanded
Ezea
ok
Shukri
how do you save a country economic situation when it's falling apart
Lilia Reply
what is the difference between economic growth and development
Fiker Reply
Economic growth as an increase in the production and consumption of goods and services within an economy.but Economic development as a broader concept that encompasses not only economic growth but also social & human well being.
Shukri
production function means
Jabir
What do you think is more important to focus on when considering inequality ?
Abdisa Reply
any question about economics?
Awais Reply
sir...I just want to ask one question... Define the term contract curve? if you are free please help me to find this answer 🙏
Asui
it is a curve that we get after connecting the pareto optimal combinations of two consumers after their mutually beneficial trade offs
Awais
thank you so much 👍 sir
Asui
In economics, the contract curve refers to the set of points in an Edgeworth box diagram where both parties involved in a trade cannot be made better off without making one of them worse off. It represents the Pareto efficient allocations of goods between two individuals or entities, where neither p
Cornelius
In economics, the contract curve refers to the set of points in an Edgeworth box diagram where both parties involved in a trade cannot be made better off without making one of them worse off. It represents the Pareto efficient allocations of goods between two individuals or entities,
Cornelius
Suppose a consumer consuming two commodities X and Y has The following utility function u=X0.4 Y0.6. If the price of the X and Y are 2 and 3 respectively and income Constraint is birr 50. A,Calculate quantities of x and y which maximize utility. B,Calculate value of Lagrange multiplier. C,Calculate quantities of X and Y consumed with a given price. D,alculate optimum level of output .
Feyisa Reply
Answer
Feyisa
c
Jabir
the market for lemon has 10 potential consumers, each having an individual demand curve p=101-10Qi, where p is price in dollar's per cup and Qi is the number of cups demanded per week by the i th consumer.Find the market demand curve using algebra. Draw an individual demand curve and the market dema
Gsbwnw Reply
suppose the production function is given by ( L, K)=L¼K¾.assuming capital is fixed find APL and MPL. consider the following short run production function:Q=6L²-0.4L³ a) find the value of L that maximizes output b)find the value of L that maximizes marginal product
Abdureman
types of unemployment
Yomi Reply
What is the difference between perfect competition and monopolistic competition?
Mohammed
Got questions? Join the online conversation and get instant answers!
Jobilize.com Reply

Get Jobilize Job Search Mobile App in your pocket Now!

Get it on Google Play Download on the App Store Now


Source:  OpenStax, Biology. OpenStax CNX. Feb 29, 2016 Download for free at http://cnx.org/content/col11448/1.10
Google Play and the Google Play logo are trademarks of Google Inc.

Notification Switch

Would you like to follow the 'Biology' conversation and receive update notifications?

Ask