<< Chapter < Page Chapter >> Page >
By the end of this section, you will be able to:
  • Describe the scientific reasons for the success of Mendel’s experimental work
  • Describe the expected outcomes of monohybrid crosses involving dominant and recessive alleles
  • Apply the sum and product rules to calculate probabilities
Sketch of Gregor Mendel, a monk who wore reading glasses and a large cross.
Johann Gregor Mendel is considered the father of genetics.

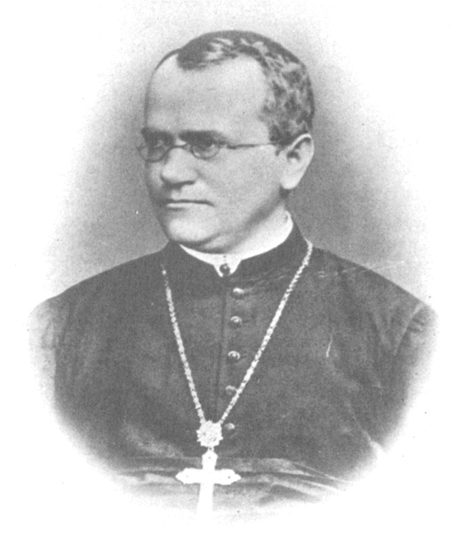
Johann Gregor Mendel (1822–1884) ( [link] ) was a lifelong learner, teacher, scientist, and man of faith. As a young adult, he joined the Augustinian Abbey of St. Thomas in Brno in what is now the Czech Republic. Supported by the monastery, he taught physics, botany, and natural science courses at the secondary and university levels. In 1856, he began a decade-long research pursuit involving inheritance patterns in honeybees and plants, ultimately settling on pea plants as his primary model system    (a system with convenient characteristics used to study a specific biological phenomenon to be applied to other systems). In 1865, Mendel presented the results of his experiments with nearly 30,000 pea plants to the local Natural History Society. He demonstrated that traits are transmitted faithfully from parents to offspring independently of other traits and in dominant and recessive patterns. In 1866, he published his work, Experiments in Plant Hybridization,

Johann Gregor Mendel, Versuche über Pflanzenhybriden Verhandlungen des naturforschenden Vereines in Brünn, Bd. IV für das Jahr , 1865 Abhandlungen, 3–47. [for English translation see http://www.mendelweb.org/Mendel.plain.html]

in the proceedings of the Natural History Society of Brünn.

Mendel’s work went virtually unnoticed by the scientific community that believed, incorrectly, that the process of inheritance involved a blending of parental traits that produced an intermediate physical appearance in offspring; this hypothetical process appeared to be correct because of what we know now as continuous variation. Continuous variation results from the action of many genes to determine a characteristic like human height. Offspring appear to be a “blend” of their parents’ traits when we look at characteristics that exhibit continuous variation. The blending theory of inheritance    asserted that the original parental traits were lost or absorbed by the blending in the offspring, but we now know that this is not the case. Mendel was the first researcher to see it. Instead of continuous characteristics, Mendel worked with traits that were inherited in distinct classes (specifically, violet versus white flowers); this is referred to as discontinuous variation    . Mendel’s choice of these kinds of traits allowed him to see experimentally that the traits were not blended in the offspring, nor were they absorbed, but rather that they kept their distinctness and could be passed on. In 1868, Mendel became abbot of the monastery and exchanged his scientific pursuits for his pastoral duties. He was not recognized for his extraordinary scientific contributions during his lifetime. In fact, it was not until 1900 that his work was rediscovered, reproduced, and revitalized by scientists on the brink of discovering the chromosomal basis of heredity.

Questions & Answers

how do you get the 2/50
Abba Reply
number of sport play by 50 student construct discrete data
Aminu Reply
width of the frangebany leaves on how to write a introduction
Theresa Reply
Solve the mean of variance
Veronica Reply
Step 1: Find the mean. To find the mean, add up all the scores, then divide them by the number of scores. ... Step 2: Find each score's deviation from the mean. ... Step 3: Square each deviation from the mean. ... Step 4: Find the sum of squares. ... Step 5: Divide the sum of squares by n – 1 or N.
kenneth
what is error
Yakuba Reply
Is mistake done to something
Vutshila
Hy
anas
hy
What is the life teble
anas
hy
Jibrin
statistics is the analyzing of data
Tajudeen Reply
what is statics?
Zelalem Reply
how do you calculate mean
Gloria Reply
diveving the sum if all values
Shaynaynay
let A1,A2 and A3 events be independent,show that (A1)^c, (A2)^c and (A3)^c are independent?
Fisaye Reply
what is statistics
Akhisani Reply
data collected all over the world
Shaynaynay
construct a less than and more than table
Imad Reply
The sample of 16 students is taken. The average age in the sample was 22 years with astandard deviation of 6 years. Construct a 95% confidence interval for the age of the population.
Aschalew Reply
Bhartdarshan' is an internet-based travel agency wherein customer can see videos of the cities they plant to visit. The number of hits daily is a normally distributed random variable with a mean of 10,000 and a standard deviation of 2,400 a. what is the probability of getting more than 12,000 hits? b. what is the probability of getting fewer than 9,000 hits?
Akshay Reply
Bhartdarshan'is an internet-based travel agency wherein customer can see videos of the cities they plan to visit. The number of hits daily is a normally distributed random variable with a mean of 10,000 and a standard deviation of 2,400. a. What is the probability of getting more than 12,000 hits
Akshay
1
Bright
Sorry i want to learn more about this question
Bright
Someone help
Bright
a= 0.20233 b=0.3384
Sufiyan
a
Shaynaynay
How do I interpret level of significance?
Mohd Reply
It depends on your business problem or in Machine Learning you could use ROC- AUC cruve to decide the threshold value
Shivam
how skewness and kurtosis are used in statistics
Owen Reply
yes what is it
Taneeya
Got questions? Join the online conversation and get instant answers!
Jobilize.com Reply

Get Jobilize Job Search Mobile App in your pocket Now!

Get it on Google Play Download on the App Store Now


Source:  OpenStax, Biology. OpenStax CNX. Feb 29, 2016 Download for free at http://cnx.org/content/col11448/1.10
Google Play and the Google Play logo are trademarks of Google Inc.

Notification Switch

Would you like to follow the 'Biology' conversation and receive update notifications?

Ask