<< Chapter < Page Chapter >> Page >

Today we see that CO 2 , H 2 O, sulfur dioxide (SO 2 ), and other gases are released from deeper within Earth through the action of volcanoes. (For CO 2 , the primary source today is the burning of fossil fuels, which releases far more CO 2 than that from volcanic eruptions.) Much of this apparently new gas, however, is recycled material that has been subducted through plate tectonics. But where did our planet’s original atmosphere come from?

Three possibilities exist for the original source of Earth’s atmosphere and oceans: (1) the atmosphere could have been formed with the rest of Earth as it accumulated from debris left over from the formation of the Sun; (2) it could have been released from the interior through volcanic activity, subsequent to the formation of Earth; or (3) it may have been derived from impacts by comets and asteroids from the outer parts of the solar system. Current evidence favors a combination of the interior and impact sources.

Weather and climate

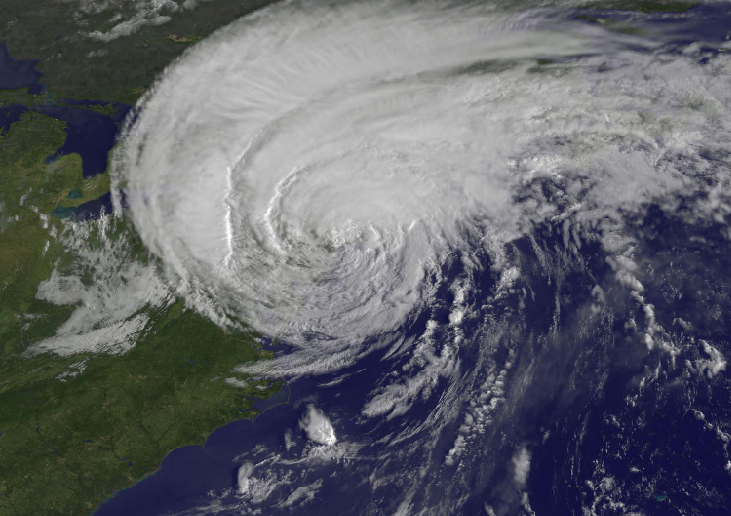
All planets with atmospheres have weather , which is the name we give to the circulation of the atmosphere. The energy that powers the weather is derived primarily from the sunlight that heats the surface. Both the rotation of the planet and slower seasonal changes cause variations in the amount of sunlight striking different parts of Earth. The atmosphere and oceans redistribute the heat from warmer to cooler areas. Weather on any planet represents the response of its atmosphere to changing inputs of energy from the Sun (see [link] for a dramatic example).

Storm from space.

Image of a Hurricane from Space. This photograph shows a huge, inverted-comma shaped storm covering much of the north-east coast of the United States.
This satellite image shows Hurricane Irene in 2011, shortly before the storm hit land in New York City. The combination of Earth’s tilted axis of rotation, moderately rapid rotation, and oceans of liquid water can lead to violent weather on our planet. (credit: NASA/NOAA GOES Project)

Climate is a term used to refer to the effects of the atmosphere that last through decades and centuries. Changes in climate (as opposed to the random variations in weather from one year to the next) are often difficult to detect over short time periods, but as they accumulate, their effect can be devastating. One saying is that “Climate is what you expect, and weather is what you get.” Modern farming is especially sensitive to temperature and rainfall; for example, calculations indicate that a drop of only 2 °C throughout the growing season would cut the wheat production by half in Canada and the United States. At the other extreme, an increase of 2 °C in the average temperature of Earth would be enough to melt many glaciers, including much of the ice cover of Greenland, raising sea level by as much as 10 meters, flooding many coastal cities and ports, and putting small islands completely under water.

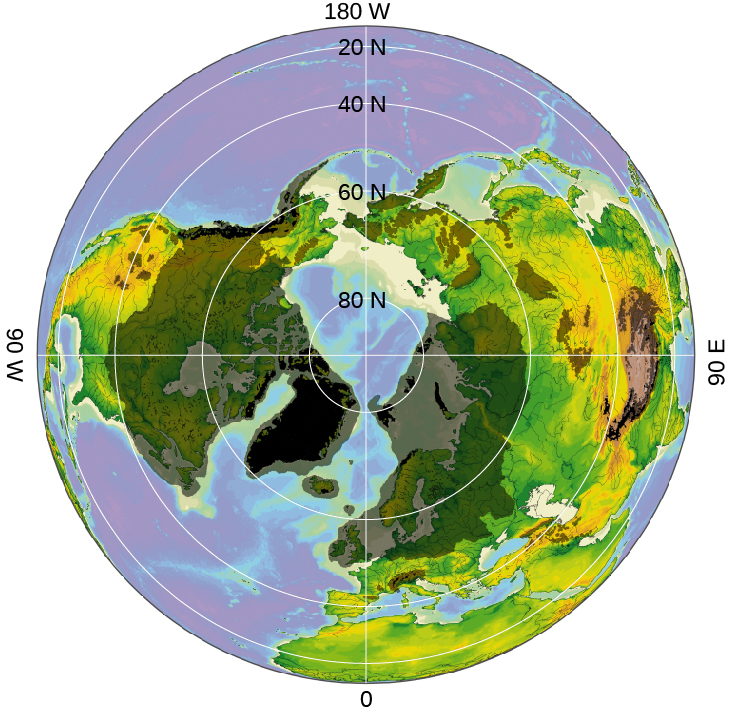
The best documented changes in Earth’s climate are the great ice ages, which have lowered the temperature of the Northern Hemisphere periodically over the past half million years or so ( [link] ). The last ice age, which ended about 14,000 years ago, lasted some 20,000 years. At its height, the ice was almost 2 kilometers thick over Boston and stretched as far south as New York City.

Ice age.

Illustration of Recent Ice Ages in the Northern Hemisphere. Looking down on the North Pole, black areas cover Greenland, the west coast of Canada, and the Himalayas indicating current glacial coverage. Over-plotted in semi-transparent grey is the extent of the last major ice age. This covered most of North America, much of Northern Europe and Siberia, and the Tibetan Plateau.
This computer-generated image shows the frozen areas of the Northern Hemisphere during past ice ages from the vantage point of looking down on the North Pole. The area in black indicates the most recent glaciation (coverage by glaciers), and the area in gray shows the maximum level of glaciation ever reached. (credit: modification of work by Hannes Grobe/AWI)

These ice ages were primarily the result of changes in the tilt of Earth’s rotational axis, produced by the gravitational effects of the other planets. We are less certain about evidence that at least once (and perhaps twice) about a billion years ago, the entire ocean froze over, a situation called snowball Earth .

The development and evolution of life on Earth has also produced changes in the composition and temperature of our planet’s atmosphere, as we shall see in the next section.

Key concepts and summary

The atmosphere has a surface pressure of 1 bar and is composed primarily of N 2 and O 2 , plus such important trace gases as H 2 O, CO 2 , and O 3 . Its structure consists of the troposphere, stratosphere, mesosphere, and ionosphere. Changing the composition of the atmosphere also influences the temperature. Atmospheric circulation (weather) is driven by seasonally changing deposition of sunlight. Many longer term climate variations, such as the ice ages, are related to changes in the planet’s orbit and axial tilt.

Questions & Answers

differentiate between demand and supply giving examples
Lambiv Reply
differentiated between demand and supply using examples
Lambiv
what is labour ?
Lambiv
how will I do?
Venny Reply
how is the graph works?I don't fully understand
Rezat Reply
information
Eliyee
devaluation
Eliyee
t
WARKISA
hi guys good evening to all
Lambiv
multiple choice question
Aster Reply
appreciation
Eliyee
explain perfect market
Lindiwe Reply
In economics, a perfect market refers to a theoretical construct where all participants have perfect information, goods are homogenous, there are no barriers to entry or exit, and prices are determined solely by supply and demand. It's an idealized model used for analysis,
Ezea
What is ceteris paribus?
Shukri Reply
other things being equal
AI-Robot
When MP₁ becomes negative, TP start to decline. Extuples Suppose that the short-run production function of certain cut-flower firm is given by: Q=4KL-0.6K2 - 0.112 • Where is quantity of cut flower produced, I is labour input and K is fixed capital input (K-5). Determine the average product of lab
Kelo
Extuples Suppose that the short-run production function of certain cut-flower firm is given by: Q=4KL-0.6K2 - 0.112 • Where is quantity of cut flower produced, I is labour input and K is fixed capital input (K-5). Determine the average product of labour (APL) and marginal product of labour (MPL)
Kelo
yes,thank you
Shukri
Can I ask you other question?
Shukri
what is monopoly mean?
Habtamu Reply
What is different between quantity demand and demand?
Shukri Reply
Quantity demanded refers to the specific amount of a good or service that consumers are willing and able to purchase at a give price and within a specific time period. Demand, on the other hand, is a broader concept that encompasses the entire relationship between price and quantity demanded
Ezea
ok
Shukri
how do you save a country economic situation when it's falling apart
Lilia Reply
what is the difference between economic growth and development
Fiker Reply
Economic growth as an increase in the production and consumption of goods and services within an economy.but Economic development as a broader concept that encompasses not only economic growth but also social & human well being.
Shukri
production function means
Jabir
What do you think is more important to focus on when considering inequality ?
Abdisa Reply
any question about economics?
Awais Reply
sir...I just want to ask one question... Define the term contract curve? if you are free please help me to find this answer 🙏
Asui
it is a curve that we get after connecting the pareto optimal combinations of two consumers after their mutually beneficial trade offs
Awais
thank you so much 👍 sir
Asui
In economics, the contract curve refers to the set of points in an Edgeworth box diagram where both parties involved in a trade cannot be made better off without making one of them worse off. It represents the Pareto efficient allocations of goods between two individuals or entities, where neither p
Cornelius
In economics, the contract curve refers to the set of points in an Edgeworth box diagram where both parties involved in a trade cannot be made better off without making one of them worse off. It represents the Pareto efficient allocations of goods between two individuals or entities,
Cornelius
Suppose a consumer consuming two commodities X and Y has The following utility function u=X0.4 Y0.6. If the price of the X and Y are 2 and 3 respectively and income Constraint is birr 50. A,Calculate quantities of x and y which maximize utility. B,Calculate value of Lagrange multiplier. C,Calculate quantities of X and Y consumed with a given price. D,alculate optimum level of output .
Feyisa Reply
Answer
Feyisa
c
Jabir
the market for lemon has 10 potential consumers, each having an individual demand curve p=101-10Qi, where p is price in dollar's per cup and Qi is the number of cups demanded per week by the i th consumer.Find the market demand curve using algebra. Draw an individual demand curve and the market dema
Gsbwnw Reply
suppose the production function is given by ( L, K)=L¼K¾.assuming capital is fixed find APL and MPL. consider the following short run production function:Q=6L²-0.4L³ a) find the value of L that maximizes output b)find the value of L that maximizes marginal product
Abdureman
types of unemployment
Yomi Reply
What is the difference between perfect competition and monopolistic competition?
Mohammed
Got questions? Join the online conversation and get instant answers!
Jobilize.com Reply
Practice Key Terms 4

Get Jobilize Job Search Mobile App in your pocket Now!

Get it on Google Play Download on the App Store Now


Source:  OpenStax, Astronomy. OpenStax CNX. Apr 12, 2017 Download for free at http://cnx.org/content/col11992/1.13
Google Play and the Google Play logo are trademarks of Google Inc.

Notification Switch

Would you like to follow the 'Astronomy' conversation and receive update notifications?

Ask