This book is written to help students understand the big picture rather than get lost in random factoids to memorize. The language is accessible and inviting. Helpful diagrams and summary tables review and encapsulate the ideas being covered. Each chapter contains interactive group activities you can assign to help students work in teams and pool their knowledge.
Interactive online resources
Interesting “Links to Learning” are scattered throughout the chapters, which direct students to online animations, short videos, or enrichment readings to enhance their learning. Also, the resources listed at the end of each chapter include links to websites and other useful educational videos.
Feature boxes that help students think outside the box
A variety of feature boxes within the chapters connect astronomy to the students’ other subjects and humanize the face of astronomy by highlighting the lives of the men and women who have been key to its progress. Besides the math examples that we’ve already mentioned, the boxes include:
Making Connections. This feature connects the chapter topic to students’ experiences with other fields, from poetry to engineering, popular culture, and natural disasters.
Voyagers in Astronomy. This feature presents brief and engaging biographies of the people behind historically significant discoveries, as well as emerging research.
Astronomy Basics. This feature explains basic science concepts that we often (incorrectly) assume students know from earlier classes.
Seeing for Yourself. This feature provides practical ways that students can make astronomical observations on their own.
End-of-chapter materials to extend students’ learning
Chapter Summaries. Summaries give the gist of each section for easy review.
For Further Exploration. This section offers a list of suggested articles, websites, and videos so students can delve into topics of interest, whether for their own learning, for homework, extra credit, or papers.
Review Questions. Review questions allow students to show you (or themselves) how well they understood the chapter.
Thought Questions. Thought questions help students assess their learning by asking for critical reflection on principles or ideas in the chapter.
Figuring For Yourself. Mathematical questions, using only basic algebra and arithmetic, allow students to apply the math principles given in the example boxes throughout the chapter.
Collaborative Group Activities. This section suggests ideas for group discussion, research, or reports.
Beautiful art program
Our comprehensive art program is designed to enhance students’ understanding of concepts through clear and effective illustrations, diagrams, and photographs. Here are a few examples.
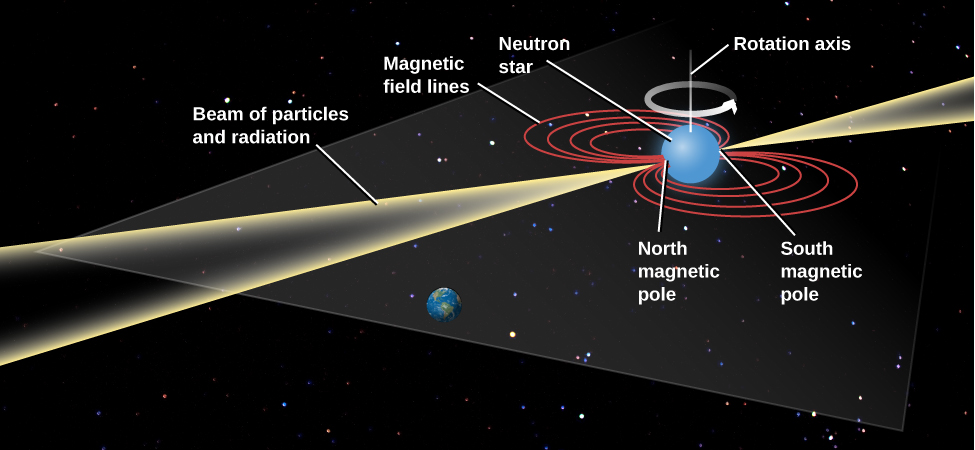
How a pulsar beam sweeps over earth.
Structure of the milky way galaxy.
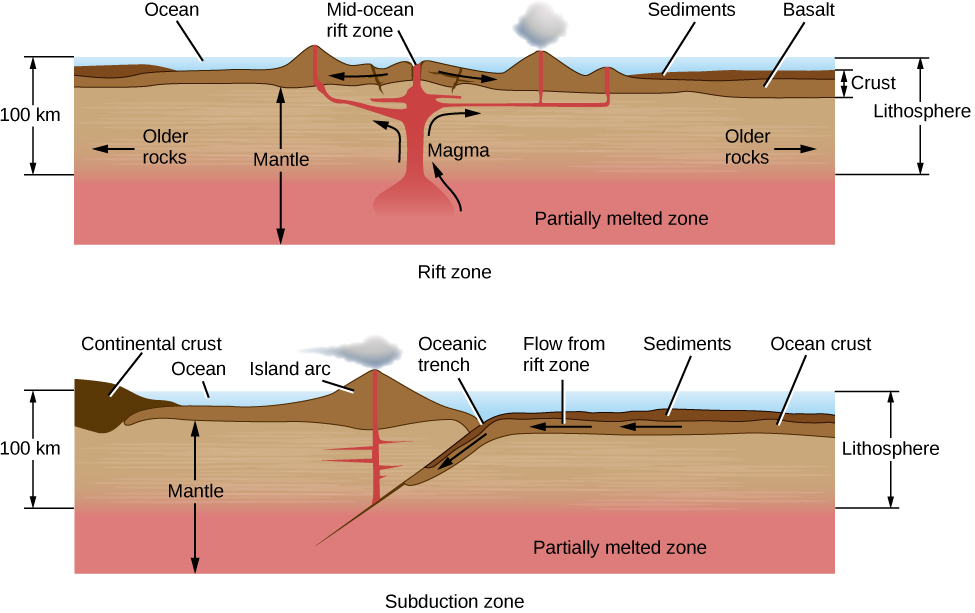
Two aspects of plate tectonics.
Pluto close up.
Additional resources
Student and instructor resources
We’ve compiled additional resources for both students and instructors, including Getting Started Guides, PowerPoint slides, and an instructor answer guide. Instructor resources require a verified instructor account, which can be requested on your openstax.org log-in. Take advantage of these resources to supplement your OpenStax book.
Questions & Answers
differentiate between demand and supply
giving examples
In economics, a perfect market refers to a theoretical construct where all participants have perfect information, goods are homogenous, there are no barriers to entry or exit, and prices are determined solely by supply and demand. It's an idealized model used for analysis,
When MP₁ becomes negative, TP start to decline.
Extuples Suppose that the short-run production function of certain cut-flower firm is given by: Q=4KL-0.6K2 - 0.112 •
Where is quantity of cut flower produced, I is labour input and K is fixed capital input (K-5). Determine the average product of lab
Kelo
Extuples Suppose that the short-run production function of certain cut-flower firm is given by: Q=4KL-0.6K2 - 0.112 •
Where is quantity of cut flower produced, I is labour input and K is fixed capital input (K-5). Determine the average product of labour (APL) and marginal product of labour (MPL)
Quantity demanded refers to the specific amount of a good or service that consumers are willing and able to purchase at a give price and within a specific time period. Demand, on the other hand, is a broader concept that encompasses the entire relationship between price and quantity demanded
Ezea
ok
Shukri
how do you save a country economic situation when it's falling apart
Economic growth as an increase in the production and consumption of goods and services within an economy.but
Economic development as a broader concept that encompasses not only economic growth but also social & human well being.
Shukri
production function means
Jabir
What do you think is more important to focus on when considering inequality ?
sir...I just want to ask one question... Define the term contract curve? if you are free please help me to find this answer 🙏
Asui
it is a curve that we get after connecting the pareto optimal combinations of two consumers after their mutually beneficial trade offs
Awais
thank you so much 👍 sir
Asui
In economics, the contract curve refers to the set of points in an Edgeworth box diagram where both parties involved in a trade cannot be made better off without making one of them worse off. It represents the Pareto efficient allocations of goods between two individuals or entities, where neither p
Cornelius
In economics, the contract curve refers to the set of points in an Edgeworth box diagram where both parties involved in a trade cannot be made better off without making one of them worse off. It represents the Pareto efficient allocations of goods between two individuals or entities,
Cornelius
Suppose a consumer consuming two commodities X and Y has
The following utility function u=X0.4 Y0.6. If the price of the X and Y are 2 and 3 respectively and income Constraint is birr 50.
A,Calculate quantities of x and y which maximize utility.
B,Calculate value of Lagrange multiplier.
C,Calculate quantities of X and Y consumed with a given price.
D,alculate optimum level of output .
the market for lemon has 10 potential consumers, each having an individual demand curve p=101-10Qi, where p is price in dollar's per cup and Qi is the number of cups demanded per week by the i th consumer.Find the market demand curve using algebra. Draw an individual demand curve and the market dema
suppose the production function is given by ( L, K)=L¼K¾.assuming capital is fixed find APL and MPL. consider the following short run production function:Q=6L²-0.4L³ a) find the value of L that maximizes output b)find the value of L that maximizes marginal product