

| << Chapter < Page | Chapter >> Page > |
This motion at the microscopic level is responsible for much of the electromagnetic radiation on Earth and in the universe. As atoms and molecules move about and collide, or vibrate in place, their electrons give off electromagnetic radiation. The characteristics of this radiation are determined by the temperature of those atoms and molecules. In a hot material, for example, the individual particles vibrate in place or move rapidly from collisions, so the emitted waves are, on average, more energetic. And recall that higher energy waves have a higher frequency. In very cool material, the particles have low-energy atomic and molecular motions and thus generate lower-energy waves.
Check out the NASA briefing or NASA’s 5-minute introductory video to learn more about the electromagnetic spectrum.
To understand, in more quantitative detail, the relationship between temperature and electromagnetic radiation, we imagine an idealized object called a blackbody . Such an object (unlike your sweater or your astronomy instructor’s head) does not reflect or scatter any radiation, but absorbs all the electromagnetic energy that falls onto it. The energy that is absorbed causes the atoms and molecules in it to vibrate or move around at increasing speeds. As it gets hotter, this object will radiate electromagnetic waves until absorption and radiation are in balance. We want to discuss such an idealized object because, as you will see, stars behave in very nearly the same way.
The radiation from a blackbody has several characteristics, as illustrated in [link] . The graph shows the power emitted at each wavelength by objects of different temperatures. In science, the word power means the energy coming off per second (and it is typically measured in watts , which you are probably familiar with from buying lightbulbs).
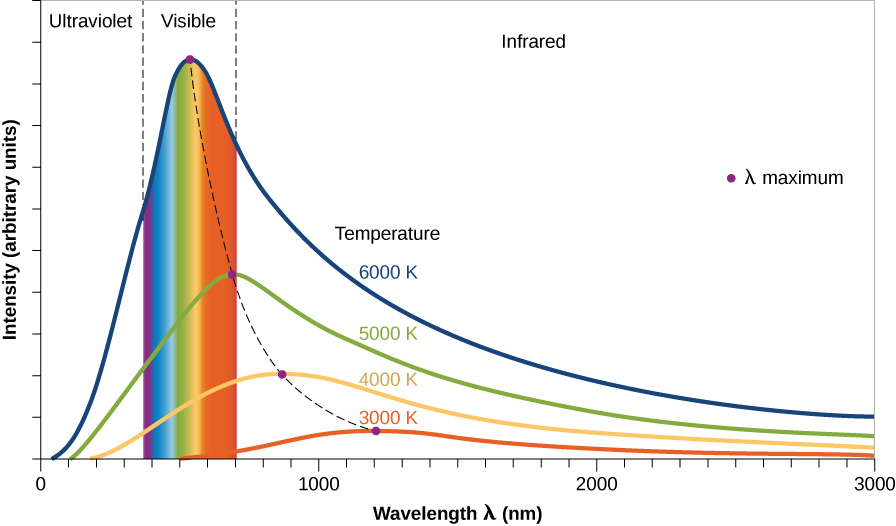
First of all, notice that the curves show that, at each temperature, our blackbody object emits radiation (photons) at all wavelengths (all colors). This is because in any solid or denser gas, some molecules or atoms vibrate or move between collisions slower than average and some move faster than average. So when we look at the electromagnetic waves emitted, we find a broad range, or spectrum, of energies and wavelengths. More energy is emitted at the average vibration or motion rate (the highest part of each curve), but if we have a large number of atoms or molecules, some energy will be detected at each wavelength.
Second, note that an object at a higher temperature emits more power at all wavelengths than does a cooler one. In a hot gas (the taller curves in [link] ), for example, the atoms have more collisions and give off more energy. In the real world of stars, this means that hotter stars give off more energy at every wavelength than do cooler stars.
Notification Switch
Would you like to follow the 'Astronomy' conversation and receive update notifications?

|
|

|
|

|
|

|
|

|
|
|
|
|

|
|

|
|

|
|

|