<< Chapter < Page Chapter >> Page >

Learning objectives

By the end of this section, you will be able to:

  • Explain how the H–R diagram    of a star cluster can be related to the cluster’s age and the stages of evolution of its stellar members
  • Describe how the main-sequence turnoff of a cluster reveals its age

In the previous section, we indicated that that open clusters are younger than globular clusters, and associations are typically even younger. In this section, we will show how we determine the ages of these star clusters. The key observation is that the stars in these different types of clusters are found in different places in the H–R diagram, and we can use their locations in the diagram in combination with theoretical calculations to estimate how long they have lived.

H–r diagrams of young clusters

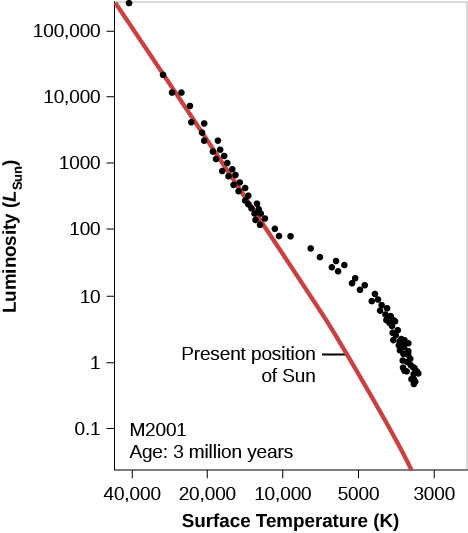
What does theory predict for the H–R diagram of a cluster whose stars have recently condensed from an interstellar cloud? Remember that at every stage of evolution, massive stars evolve more quickly than their lower-mass counterparts. After a few million years (“recently” for astronomers), the most massive stars should have completed their contraction phase and be on the main sequence, while the less massive ones should be off to the right, still on their way to the main sequence. These ideas are illustrated in [link] , which shows the H–R diagram calculated by R. Kippenhahn and his associates at Munich University for a hypothetical cluster with an age of 3 million years.
Young cluster h–r diagram.

Hypothetical H-R Diagram of a Young Cluster. In this plot titled “M 2001 Age: 3 million years,” the vertical axis is labeled “Luminosity (LSun),” and goes from 0.1 at the bottom to 100,000 at the top. The horizontal axis is labeled “Surface Temperature (K)”, and goes from 40,000 on the left to 3,000 on the right. The zero-age main sequence is drawn as a red diagonal line starting just above 100,000 LSun at the top of the graph down to about 4000 K at the bottom. The “Present position of Sun” is indicated at 5500 K and 1 LSun. Over-plotted on the graph are black dots representing the individual stars in the cluster. About half of the dots lie neatly along the red line until about 10000 K and 100 LSun. At this point, the remainder of the dots lie above the red line, meaning these stars have yet to reach the main sequence.
We see an H–R diagram for a hypothetical young cluster with an age of 3 million years. Note that the high-mass (high-luminosity) stars have already arrived at the main-sequence stage of their lives, while the lower-mass (lower-luminosity) stars are still contracting toward the zero-age main sequence (the red line) and are not yet hot enough to derive all of their energy from the fusion of hydrogen.

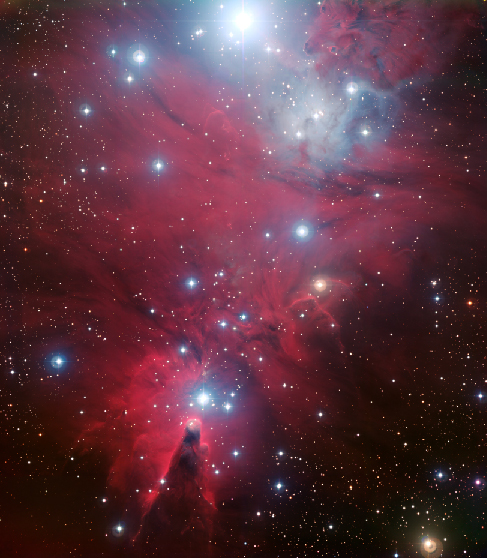
There are real star clusters that fit this description. The first to be studied (in about 1950) was NGC 2264, which is still associated with the region of gas and dust from which it was born ( [link] ).
Young cluster ngc 2264.

Image of the Young Cluster N G C 2264. This youthful cluster derives its name from the shape outlined by its brightest stars. The “Christmas Tree” is upside down in this image. The brightest star at the top of the frame is the base of the tree. The top of the tree is the star above the dark v-shaped lane in the nebula just left of the center at the bottom of the image.
Located about 2600 light-years from us, this region of newly formed stars, known as the Christmas Tree Cluster, is a complex mixture of hydrogen gas (which is ionized by hot embedded stars and shown in red), dark obscuring dust lanes, and brilliant young stars. The image shows a scene about 30 light-years across. (credit: ESO)

The NGC 2264 cluster’s H–R diagram is shown in [link] . The cluster in the middle of the Orion Nebula (shown in [link] and [link] ) is in a similar stage of evolution.

Ngc 2264 h–r diagram.

In this plot the vertical axis is labeled “Luminosity (LSun)” and goes from 0.1 at the bottom to 100,000 at the top. The horizontal axis is labeled “Surface Temperature (K)” and goes from 40,000 on the left to 3,000 on the right. The zero-age main sequence is drawn as a red diagonal line starting just above 100,000 LSun at the top of the graph down to about 4000 K at the bottom. Over plotted are the observed values of stars in N G C 2264, shown as black dots. Stars lie on the line until about 10000 K and 10 LSun, below which the stars reside above the main sequence.
Compare this H–R diagram to that in [link] ; although the points scatter a bit more here, the theoretical and observational diagrams are remarkably, and satisfyingly, similar.

As clusters get older, their H–R diagrams begin to change. After a short time (less than a million years after they reach the main sequence), the most massive stars use up the hydrogen in their cores and evolve off the main sequence to become red giants and supergiants. As more time passes, stars of lower mass begin to leave the main sequence and make their way to the upper right of the H–R diagram.

Questions & Answers

what is biology
Hajah Reply
the study of living organisms and their interactions with one another and their environments
AI-Robot
what is biology
Victoria Reply
HOW CAN MAN ORGAN FUNCTION
Alfred Reply
the diagram of the digestive system
Assiatu Reply
allimentary cannel
Ogenrwot
How does twins formed
William Reply
They formed in two ways first when one sperm and one egg are splited by mitosis or two sperm and two eggs join together
Oluwatobi
what is genetics
Josephine Reply
Genetics is the study of heredity
Misack
how does twins formed?
Misack
What is manual
Hassan Reply
discuss biological phenomenon and provide pieces of evidence to show that it was responsible for the formation of eukaryotic organelles
Joseph Reply
what is biology
Yousuf Reply
the study of living organisms and their interactions with one another and their environment.
Wine
discuss the biological phenomenon and provide pieces of evidence to show that it was responsible for the formation of eukaryotic organelles in an essay form
Joseph Reply
what is the blood cells
Shaker Reply
list any five characteristics of the blood cells
Shaker
lack electricity and its more savely than electronic microscope because its naturally by using of light
Abdullahi Reply
advantage of electronic microscope is easily and clearly while disadvantage is dangerous because its electronic. advantage of light microscope is savely and naturally by sun while disadvantage is not easily,means its not sharp and not clear
Abdullahi
cell theory state that every organisms composed of one or more cell,cell is the basic unit of life
Abdullahi
is like gone fail us
DENG
cells is the basic structure and functions of all living things
Ramadan
What is classification
ISCONT Reply
is organisms that are similar into groups called tara
Yamosa
in what situation (s) would be the use of a scanning electron microscope be ideal and why?
Kenna Reply
A scanning electron microscope (SEM) is ideal for situations requiring high-resolution imaging of surfaces. It is commonly used in materials science, biology, and geology to examine the topography and composition of samples at a nanoscale level. SEM is particularly useful for studying fine details,
Hilary
cell is the building block of life.
Condoleezza Reply
Got questions? Join the online conversation and get instant answers!
Jobilize.com Reply
Practice Key Terms 1

Get Jobilize Job Search Mobile App in your pocket Now!

Get it on Google Play Download on the App Store Now


Source:  OpenStax, Astronomy. OpenStax CNX. Apr 12, 2017 Download for free at http://cnx.org/content/col11992/1.13
Google Play and the Google Play logo are trademarks of Google Inc.

Notification Switch

Would you like to follow the 'Astronomy' conversation and receive update notifications?

Ask