<< Chapter < Page Chapter >> Page >

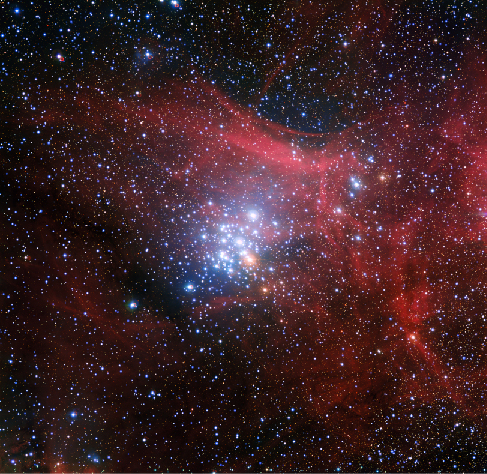
[link] is a photograph of NGC 3293, a cluster that is about 10 million years old. The dense clouds of gas and dust are gone. One massive star has evolved to become a red giant and stands out as an especially bright orange member of the cluster.

Ngc 3293.

Image of N G C 3293. This compact cluster of bright, blue stars is located near the center of this image surrounded by the red wisps of ionized hydrogen left over after the cluster’s formation.
All the stars in an open star cluster like NGC 3293 form at about the same time. The most massive stars, however, exhaust their nuclear fuel more rapidly and hence evolve more quickly than stars of low mass. As stars evolve, they become redder. The bright orange star in NGC 3293 is the member of the cluster that has evolved most rapidly. (credit: ESO/G. Beccari)

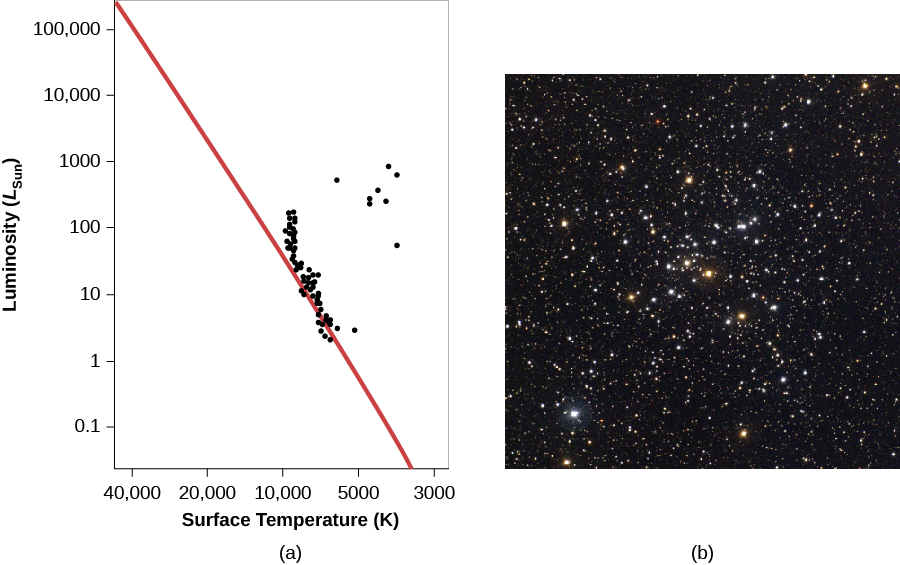
[link] shows the H–R diagram of the open cluster M41, which is roughly 100 million years old; by this time, a significant number of stars have moved off to the right and become red giants. Note the gap that appears in this H–R diagram between the stars near the main sequence and the red giants. A gap does not necessarily imply that stars avoid a region of certain temperatures and luminosities. In this case, it simply represents a domain of temperature and luminosity through which stars evolve very quickly. We see a gap for M41 because at this particular moment, we have not caught a star in the process of scurrying across this part of the diagram.

Cluster m41.

In panel (a), on the left, the vertical axis is labeled “Luminosity (LSun)” and goes from 0.1 at the bottom to 100,000 at the top. The horizontal axis is labeled “Surface Temperature (K)” and goes from 40,000 on the left to 3000 on the right. The zero-age main sequence is drawn as a red diagonal line starting just above 100,000 LSun at the top of the graph down to about 4000 K at the bottom. Over plotted are the observed values of the stars in M 41. Approximately half of the stars lie above the main sequence until around 9000 K and 50 LSun, below which the stars all lie on the main sequence. On the right side of the diagram, a small grouping of giant stars are centered around 4000 K and 50 LSun. Panel (b), on the right, shows a photograph of the open cluster M 41.
(a) Cluster M41 is older than NGC 2264 (see [link] ) and contains several red giants. Some of its more massive stars are no longer close to the zero-age main sequence (red line). (b) This ground-based photograph shows the open cluster M41. Note that it contains several orange-color stars. These are stars that have exhausted hydrogen in their centers, and have swelled up to become red giants. (credit b: modification of work by NOAO/AURA/NSF)

H–r diagrams of older clusters

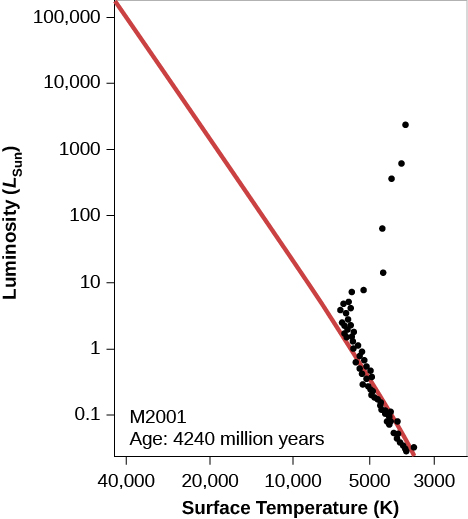
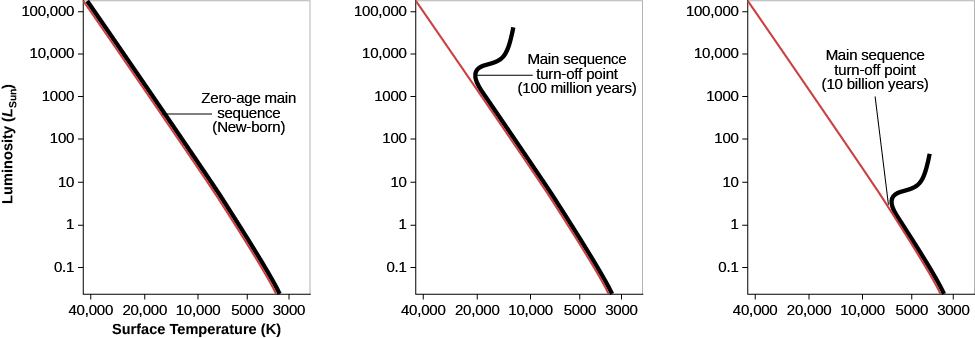
After 4 billion years have passed, many more stars, including stars that are only a few times more massive than the Sun, have left the main sequence ( [link] ). This means that no stars are left near the top of the main sequence; only the low-mass stars near the bottom remain. The older the cluster, the lower the point on the main sequence (and the lower the mass of the stars) where stars begin to move toward the red giant region. The location in the H–R diagram where the stars have begun to leave the main sequence is called the main-sequence turnoff    .

H–r diagram for an older cluster.

Hypothetical H-R Diagram of an Older Cluster. In this plot titled “M 2001 Age: 4240 million years,” the vertical axis is labeled “Luminosity (LSun)” and goes from 0.1 at the bottom to 100,000 at the top. The horizontal axis is labeled “Surface Temperature (K)” and goes from 40,000 on the left to 3000 on the right. The zero-age main sequence is drawn as a red diagonal line starting just above 100,000 LSun at the top of the graph down to about 4000 K at the bottom. Over-plotted on the graph are black dots representing the individual stars in the cluster. Several of the stars are plotted above and to the right of the main sequence and represent the stars that have begun to enter the giant phase of their evolution. Below about 6500 K and 5 LSun the remaining stars lie on the main sequence.
We see the H–R diagram for a hypothetical older cluster at an age of 4.24 billion years. Note that most of the stars on the upper part of the main sequence have turned off toward the red-giant region. And the most massive stars in the cluster have already died and are no longer on the diagram.

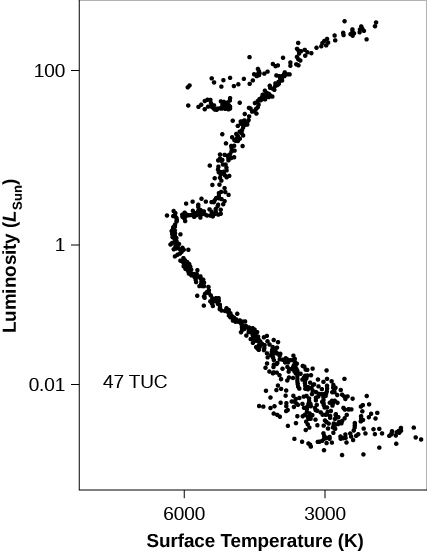
The oldest clusters of all are the globular clusters. [link] shows the H–R diagram of globular cluster 47 Tucanae. Notice that the luminosity and temperature scales are different from those of the other H–R diagrams in this chapter. In [link] , for example, the luminosity scale on the left side of the diagram goes from 0.1 to 100,000 times the Sun’s luminosity. But in [link] , the luminosity scale has been significantly reduced in extent. So many stars in this old cluster have had time to turn off the main sequence that only the very bottom of the main sequence remains.

Cluster 47 tucanae.

H-R Diagram of 47 Tucanae. In this plot the vertical axis is labeled “Luminosity (LSun)” and goes from 0.01 near the bottom to 100 near the top. The horizontal axis is labeled “Surface Temperature (K)” and goes from 6000 on the left to 3000 on the right. Black dots represent observations of the stars in 47 Tuc. The giant and supergiant branches are seen above Luminosity =1, where the main sequence turn-off begins. The main sequence is well defined from L=1 down to L=0.01, below which there is scatter in the data points due to the faintness of these low-mass stars.
This H–R diagram is for the globular cluster 47. Note that the scale of luminosity differs from that of the other H–R diagrams in this chapter. We are only focusing on the lower portion of the main sequence, the only part where stars still remain in this old cluster.

Just how old are the different clusters we have been discussing? To get their actual ages (in years), we must compare the appearances of our calculated H–R diagrams of different ages to observed H–R diagrams of real clusters. In practice, astronomers use the position at the top of the main sequence (that is, the luminosity at which stars begin to move off the main sequence to become red giants) as a measure of the age of a cluster (the main-sequence turnoff we discussed previously). For example, we can compare the luminosities of the brightest stars that are still on the main sequence in [link] and [link] .

Using this method, some associations and open clusters turn out to be as young as 1 million years old, while others are several hundred million years old. Once all of the interstellar matter surrounding a cluster has been used to form stars or has dispersed and moved away from the cluster, star formation ceases, and stars of progressively lower mass move off the main sequence, as shown in [link] , [link] , and [link] .

To our surprise, even the youngest of the globular clusters in our Galaxy are found to be older than the oldest open cluster. All of the globular clusters have main sequences that turn off at a luminosity less than that of the Sun. Star formation in these crowded systems ceased billions of years ago, and no new stars are coming on to the main sequence to replace the ones that have turned off (see [link] ).

H–r diagrams for clusters of different ages.

Simplified H-R Diagrams for Clusters of Different Ages. Each of the three diagrams in this figure have the vertical axis labeled “Luminosity” in arbitrary units and the horizontal axis labeled “Temperature” in arbitrary units. Each also has the “Zero-age Main Sequence” drawn as a red line running from the top left of the diagram to the bottom right. The stars in each diagram are represented as a solid black line. In the left-most diagram, labeled “New-born,” all the cluster stars lie on the Z A M S. The diagram at center is labeled “100 million years,” with the giant branch turning away from the Z A M S in the upper left portion of the diagram. Finally, in the right hand diagram, labeled “10 billion years,” the giant branch turns off the Z A M S in the lower right portion of the diagram.
This sketch shows how the turn-off point from the main sequence gets lower as we make H–R diagrams for clusters that are older and older.

Indeed, the globular clusters are the oldest structures in our Galaxy (and in other galaxies as well). The youngest have ages of about 11 billion years and some appear to be even older. Since these are the oldest objects we know of, this estimate is one of the best limits we have on the age of the universe itself—it must be at least 11 billion years old. We will return to the fascinating question of determining the age of the entire universe in the chapter on The Big Bang .

Key concepts and summary

The H–R diagram of stars in a cluster changes systematically as the cluster grows older. The most massive stars evolve most rapidly. In the youngest clusters and associations, highly luminous blue stars are on the main sequence; the stars with the lowest masses lie to the right of the main sequence and are still contracting toward it. With passing time, stars of progressively lower masses evolve away from (or turn off) the main sequence. In globular clusters, which are all at least 11 billion years old, there are no luminous blue stars at all. Astronomers can use the turnoff point from the main sequence to determine the age of a cluster.

Questions & Answers

how does Neisseria cause meningitis
Nyibol Reply
what is microbiologist
Muhammad Reply
what is errata
Muhammad
is the branch of biology that deals with the study of microorganisms.
Ntefuni Reply
What is microbiology
Mercy Reply
studies of microbes
Louisiaste
when we takee the specimen which lumbar,spin,
Ziyad Reply
How bacteria create energy to survive?
Muhamad Reply
Bacteria doesn't produce energy they are dependent upon their substrate in case of lack of nutrients they are able to make spores which helps them to sustain in harsh environments
_Adnan
But not all bacteria make spores, l mean Eukaryotic cells have Mitochondria which acts as powerhouse for them, since bacteria don't have it, what is the substitution for it?
Muhamad
they make spores
Louisiaste
what is sporadic nd endemic, epidemic
Aminu Reply
the significance of food webs for disease transmission
Abreham
food webs brings about an infection as an individual depends on number of diseased foods or carriers dully.
Mark
explain assimilatory nitrate reduction
Esinniobiwa Reply
Assimilatory nitrate reduction is a process that occurs in some microorganisms, such as bacteria and archaea, in which nitrate (NO3-) is reduced to nitrite (NO2-), and then further reduced to ammonia (NH3).
Elkana
This process is called assimilatory nitrate reduction because the nitrogen that is produced is incorporated in the cells of microorganisms where it can be used in the synthesis of amino acids and other nitrogen products
Elkana
Examples of thermophilic organisms
Shu Reply
Give Examples of thermophilic organisms
Shu
advantages of normal Flora to the host
Micheal Reply
Prevent foreign microbes to the host
Abubakar
they provide healthier benefits to their hosts
ayesha
They are friends to host only when Host immune system is strong and become enemies when the host immune system is weakened . very bad relationship!
Mark
what is cell
faisal Reply
cell is the smallest unit of life
Fauziya
cell is the smallest unit of life
Akanni
ok
Innocent
cell is the structural and functional unit of life
Hasan
is the fundamental units of Life
Musa
what are emergency diseases
Micheal Reply
There are nothing like emergency disease but there are some common medical emergency which can occur simultaneously like Bleeding,heart attack,Breathing difficulties,severe pain heart stock.Hope you will get my point .Have a nice day ❣️
_Adnan
define infection ,prevention and control
Innocent
I think infection prevention and control is the avoidance of all things we do that gives out break of infections and promotion of health practices that promote life
Lubega
Heyy Lubega hussein where are u from?
_Adnan
en français
Adama
which site have a normal flora
ESTHER Reply
Many sites of the body have it Skin Nasal cavity Oral cavity Gastro intestinal tract
Safaa
skin
Asiina
skin,Oral,Nasal,GIt
Sadik
How can Commensal can Bacteria change into pathogen?
Sadik
How can Commensal Bacteria change into pathogen?
Sadik
all
Tesfaye
by fussion
Asiina
what are the advantages of normal Flora to the host
Micheal
what are the ways of control and prevention of nosocomial infection in the hospital
Micheal
what is inflammation
Shelly Reply
part of a tissue or an organ being wounded or bruised.
Wilfred
what term is used to name and classify microorganisms?
Micheal Reply
Binomial nomenclature
adeolu
Got questions? Join the online conversation and get instant answers!
Jobilize.com Reply
Practice Key Terms 1

Get Jobilize Job Search Mobile App in your pocket Now!

Get it on Google Play Download on the App Store Now


Source:  OpenStax, Astronomy. OpenStax CNX. Apr 12, 2017 Download for free at http://cnx.org/content/col11992/1.13
Google Play and the Google Play logo are trademarks of Google Inc.

Notification Switch

Would you like to follow the 'Astronomy' conversation and receive update notifications?

Ask