<< Chapter < Page Chapter >> Page >

Contrast this with the situation today, when scientists rush to test each new hypothesis and do not accept any ideas until the results are in. For example, when two researchers at the University of Utah announced in 1989 that they had discovered a way to achieve nuclear fusion (the process that powers the stars) at room temperature, other scientists at more than 25 laboratories around the United States attempted to duplicate “cold fusion” within a few weeks—without success, as it turned out. The cold fusion theory soon went down in flames.

How would we look at Copernicus’ model today? When a new hypothesis or theory is proposed in science, it must first be checked for consistency with what is already known. Copernicus’ heliocentric idea passes this test, for it allows planetary positions to be calculated at least as well as does the geocentric theory. The next step is to determine which predictions the new hypothesis makes that differ from those of competing ideas. In the case of Copernicus , one example is the prediction that, if Venus circles the Sun, the planet should go through the full range of phases just as the Moon does, whereas if it circles Earth, it should not ( [link] ). Also, we should not be able to see the full phase of Venus from Earth because the Sun would then be between Venus and Earth. But in those days, before the telescope, no one imagined testing these predictions.
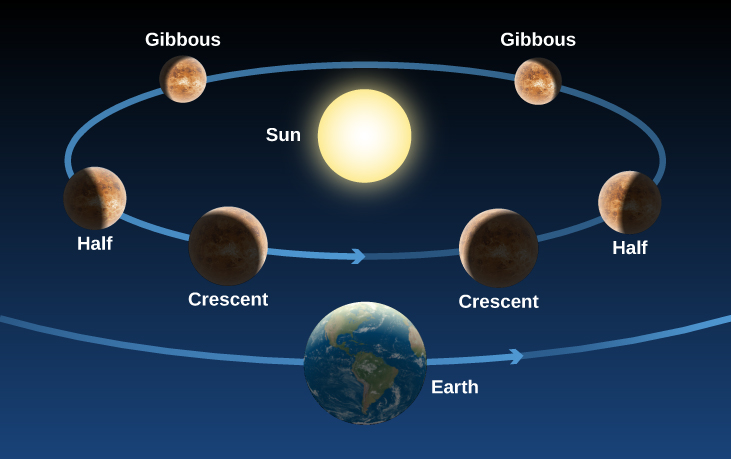
Phases of venus.

The phases of Venus as seen from Earth. At bottom center of this illustration the Earth is shown with an arrow pointing to the right indicating its direction of motion. Directly above the center of the diagram is the Sun. A blue ellipse is drawn around the Sun with an arrow pointing to the right, representing the orbit and motion of Venus. Venus is drawn in six different positions along its orbit to illustrate the different phases. The three on the left side of the orbit show the phases as Venus approaches Earth, with sunlight arriving from the right. Beginning at upper left, Venus is further from Earth than the Sun and appears gibbous. As Venus travels to a point on the left side of the orbit it appears half illuminated as seen from Earth. As Venus gets closer to the line between Earth and Sun, it appears as a thin crescent. The three positions on the right side of the orbit show the phases as Venus gets farther from Earth, with sunlight arriving from the left. The right side of the diagram is a mirror view of the left. Venus appears as thin crescent close to Earth, then moves further to the right to appear half illuminated, and finally appears as gibbous before moving behind the Sun.
As Venus moves around the Sun, we see changing illumination of its surface, just as we see the face of the Moon illuminated differently in the course of a month.

Galileo and the beginning of modern science

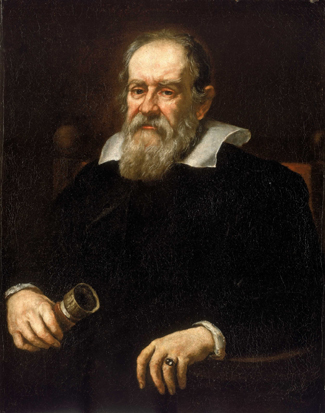
Many of the modern scientific concepts of observation, experimentation, and the testing of hypotheses through careful quantitative measurements were pioneered by a man who lived nearly a century after Copernicus. Galileo Galilei ( [link] ), a contemporary of Shakespeare, was born in Pisa. Like Copernicus, he began training for a medical career, but he had little interest in the subject and later switched to mathematics. He held faculty positions at the University of Pisa and the University of Padua, and eventually became mathematician to the Grand Duke of Tuscany in Florence.

Galileo galilei (1564–1642).

Painting of Galileo Galilei.
Galileo advocated that we perform experiments or make observations to ask nature its ways. When Galileo turned the telescope to the sky, he found things were not the way philosophers had supposed.

Galileo’s greatest contributions were in the field of mechanics, the study of motion and the actions of forces on bodies. It was familiar to all persons then, as it is to us now, that if something is at rest, it tends to remain at rest and requires some outside influence to start it in motion. Rest was thus generally regarded as the natural state of matter. Galileo showed, however, that rest is no more natural than motion.

If an object is slid along a rough horizontal floor, it soon comes to rest because friction between it and the floor acts as a retarding force. However, if the floor and the object are both highly polished, the object, given the same initial speed, will slide farther before stopping. On a smooth layer of ice, it will slide farther still. Galileo reasoned that if all resisting effects could be removed, the object would continue in a steady state of motion indefinitely. He argued that a force is required not only to start an object moving from rest but also to slow down, stop, speed up, or change the direction of a moving object. You will appreciate this if you have ever tried to stop a rolling car by leaning against it, or a moving boat by tugging on a line.

Questions & Answers

What are the factors that affect demand for a commodity
Florence Reply
differentiate between demand and supply giving examples
Lambiv Reply
differentiated between demand and supply using examples
Lambiv
what is labour ?
Lambiv
how will I do?
Venny Reply
how is the graph works?I don't fully understand
Rezat Reply
information
Eliyee
devaluation
Eliyee
t
WARKISA
hi guys good evening to all
Lambiv
multiple choice question
Aster Reply
appreciation
Eliyee
explain perfect market
Lindiwe Reply
In economics, a perfect market refers to a theoretical construct where all participants have perfect information, goods are homogenous, there are no barriers to entry or exit, and prices are determined solely by supply and demand. It's an idealized model used for analysis,
Ezea
What is ceteris paribus?
Shukri Reply
other things being equal
AI-Robot
When MP₁ becomes negative, TP start to decline. Extuples Suppose that the short-run production function of certain cut-flower firm is given by: Q=4KL-0.6K2 - 0.112 • Where is quantity of cut flower produced, I is labour input and K is fixed capital input (K-5). Determine the average product of lab
Kelo
Extuples Suppose that the short-run production function of certain cut-flower firm is given by: Q=4KL-0.6K2 - 0.112 • Where is quantity of cut flower produced, I is labour input and K is fixed capital input (K-5). Determine the average product of labour (APL) and marginal product of labour (MPL)
Kelo
yes,thank you
Shukri
Can I ask you other question?
Shukri
what is monopoly mean?
Habtamu Reply
What is different between quantity demand and demand?
Shukri Reply
Quantity demanded refers to the specific amount of a good or service that consumers are willing and able to purchase at a give price and within a specific time period. Demand, on the other hand, is a broader concept that encompasses the entire relationship between price and quantity demanded
Ezea
ok
Shukri
how do you save a country economic situation when it's falling apart
Lilia Reply
what is the difference between economic growth and development
Fiker Reply
Economic growth as an increase in the production and consumption of goods and services within an economy.but Economic development as a broader concept that encompasses not only economic growth but also social & human well being.
Shukri
production function means
Jabir
What do you think is more important to focus on when considering inequality ?
Abdisa Reply
any question about economics?
Awais Reply
sir...I just want to ask one question... Define the term contract curve? if you are free please help me to find this answer 🙏
Asui
it is a curve that we get after connecting the pareto optimal combinations of two consumers after their mutually beneficial trade offs
Awais
thank you so much 👍 sir
Asui
In economics, the contract curve refers to the set of points in an Edgeworth box diagram where both parties involved in a trade cannot be made better off without making one of them worse off. It represents the Pareto efficient allocations of goods between two individuals or entities, where neither p
Cornelius
In economics, the contract curve refers to the set of points in an Edgeworth box diagram where both parties involved in a trade cannot be made better off without making one of them worse off. It represents the Pareto efficient allocations of goods between two individuals or entities,
Cornelius
Suppose a consumer consuming two commodities X and Y has The following utility function u=X0.4 Y0.6. If the price of the X and Y are 2 and 3 respectively and income Constraint is birr 50. A,Calculate quantities of x and y which maximize utility. B,Calculate value of Lagrange multiplier. C,Calculate quantities of X and Y consumed with a given price. D,alculate optimum level of output .
Feyisa Reply
Answer
Feyisa
c
Jabir
the market for lemon has 10 potential consumers, each having an individual demand curve p=101-10Qi, where p is price in dollar's per cup and Qi is the number of cups demanded per week by the i th consumer.Find the market demand curve using algebra. Draw an individual demand curve and the market dema
Gsbwnw Reply
suppose the production function is given by ( L, K)=L¼K¾.assuming capital is fixed find APL and MPL. consider the following short run production function:Q=6L²-0.4L³ a) find the value of L that maximizes output b)find the value of L that maximizes marginal product
Abdureman
Got questions? Join the online conversation and get instant answers!
Jobilize.com Reply

Get Jobilize Job Search Mobile App in your pocket Now!

Get it on Google Play Download on the App Store Now


Source:  OpenStax, Astronomy. OpenStax CNX. Apr 12, 2017 Download for free at http://cnx.org/content/col11992/1.13
Google Play and the Google Play logo are trademarks of Google Inc.

Notification Switch

Would you like to follow the 'Astronomy' conversation and receive update notifications?

Ask