<< Chapter < Page Chapter >> Page >

Rift and subduction zones

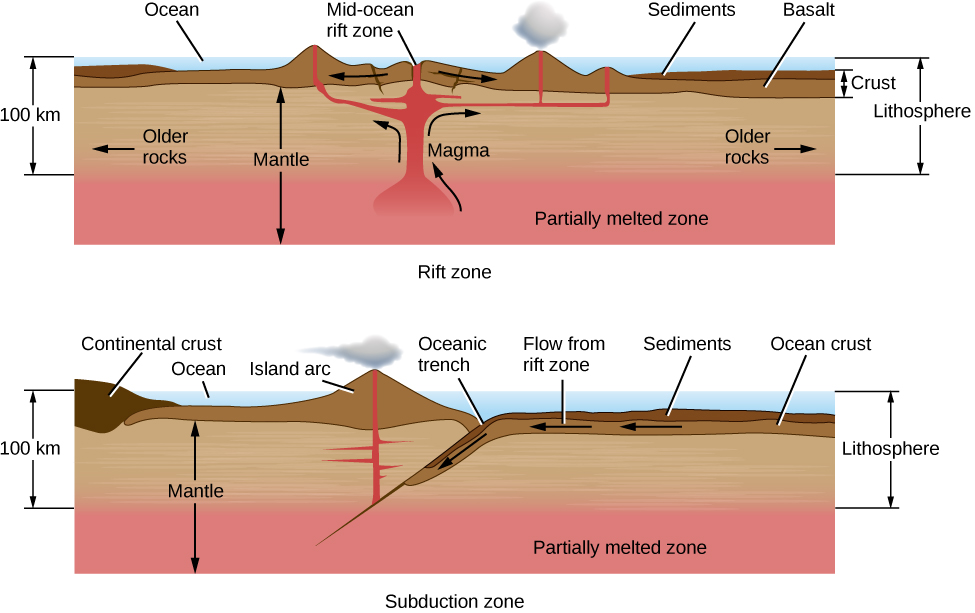
Plates pull apart from each other along rift zones , such as the Mid-Atlantic ridge, driven by upwelling currents in the mantle ( [link] ). A few rift zones are found on land. The best known is the central African rift—an area where the African continent is slowly breaking apart. Most rift zones, however, are in the oceans. Molten rock rises from below to fill the space between the receding plates; this rock is basaltic lava, the kind of igneous rock that forms most of the ocean basins.

Rift zone and subduction zone.

Illustration of Rift and Subduction Zones. The upper panel shows a rift zone beneath an ocean. At left is a vertical scale of 100 km, from the ocean surface down to the top of the mantle’s partially melted zone, which is labeled at the bottom of the diagram. At top center the mid-ocean rift zone is shown, with arrows pointing left and right indicating the direction of plate motion. Directly below the rift zone magma rises up to fill the spaces and cracks between the separating plates, creating mountains and volcanoes. At far right, the thickness of the crust is indicated, consisting of the basalt from the volcanoes and sediment from their erosion. The thickness of the lithosphere is also shown, from the ocean surface down to the top of the mantle’s partially melted zone. Finally, at the left and right portions of the illustration the older rocks are labeled, with arrows pointing away from the rift zone. The further from the rift, the older the rocks. The lower panel shows a subduction zone beneath an ocean. At left is a vertical scale of 100 km, from the ocean surface down to the top of the mantle’s partially melted zone, which is labeled at the bottom of the diagram. At top center the oceanic trench is labeled. To the right of the trench ocean crust and sediments are indicated, with arrows pointing left showing the motion of the crust toward the trench. At the trench, the ocean crust is forced beneath the continental crust, which is labeled on the left of the diagram. The ocean crust moves down toward the partially melted zone. As it does so, the melting ocean crust becomes hot enough to rise up to the surface (to the left of the trench in this diagram) and create the volcanoes of an island chain. At far right the thickness of the lithosphere is shown, from the ocean surface down to the top of the mantle’s partially melted zone.
Rift and subduction zones are the regions (mostly beneath the oceans) where new crust is formed and old crust is destroyed as part of the cycle of plate tectonics.

From a knowledge of how the seafloor is spreading, we can calculate the average age of the oceanic crust. About 60,000 kilometers of active rifts have been identified, with average separation rates of about 4 centimeters per year. The new area added to Earth each year is about 2 square kilometers, enough to renew the entire oceanic crust in a little more than 100 million years. This is a very short interval in geological time—less than 3% of the age of Earth. The present ocean basins thus turn out to be among the youngest features on our planet.

As new crust is added to Earth, the old crust must go somewhere. When two plates come together, one plate is often forced beneath another in what is called a subduction    zone ( [link] ). In general, the thick continental masses cannot be subducted, but the thinner oceanic plates can be rather readily thrust down into the upper mantle. Often a subduction zone is marked by an ocean trench; a fine example of this type of feature is the deep Japan trench along the coast of Asia. The subducted plate is forced down into regions of high pressure and temperature, eventually melting several hundred kilometers below the surface. Its material is recycled into a downward-flowing convection current, ultimately balancing the flow of material that rises along rift zones. The amount of crust destroyed at subduction zones is approximately equal to the amount formed at rift zones.

All along the subduction zone, earthquakes and volcanoes mark the death throes of the plate. Some of the most destructive earthquakes in history have taken place along subduction zones, including the 1923 Yokohama earthquake and fire that killed 100,000 people, the 2004 Sumatra earthquake and tsunami that killed more than 200,000 people, and the 2011 Tohoku earthquake that resulted in the meltdown of three nuclear power reactors in Japan.

Fault zones and mountain building

Along much of their length, the crustal plates slide parallel to each other. These plate boundaries are marked by cracks or faults . Along active fault zones, the motion of one plate with respect to the other is several centimeters per year, about the same as the spreading rates along rifts.

One of the most famous faults is the San Andreas Fault in California, which lies at the boundary between the Pacific plate and the North American plate ( [link] ). This fault runs from the Gulf of California to the Pacific Ocean northwest of San Francisco. The Pacific plate, to the west, is moving northward, carrying Los Angeles, San Diego, and parts of the southern California coast with it. In several million years, Los Angeles may be an island off the coast of San Francisco.

Questions & Answers

differentiate between demand and supply giving examples
Lambiv Reply
differentiated between demand and supply using examples
Lambiv
what is labour ?
Lambiv
how will I do?
Venny Reply
how is the graph works?I don't fully understand
Rezat Reply
information
Eliyee
devaluation
Eliyee
t
WARKISA
hi guys good evening to all
Lambiv
multiple choice question
Aster Reply
appreciation
Eliyee
explain perfect market
Lindiwe Reply
In economics, a perfect market refers to a theoretical construct where all participants have perfect information, goods are homogenous, there are no barriers to entry or exit, and prices are determined solely by supply and demand. It's an idealized model used for analysis,
Ezea
What is ceteris paribus?
Shukri Reply
other things being equal
AI-Robot
When MP₁ becomes negative, TP start to decline. Extuples Suppose that the short-run production function of certain cut-flower firm is given by: Q=4KL-0.6K2 - 0.112 • Where is quantity of cut flower produced, I is labour input and K is fixed capital input (K-5). Determine the average product of lab
Kelo
Extuples Suppose that the short-run production function of certain cut-flower firm is given by: Q=4KL-0.6K2 - 0.112 • Where is quantity of cut flower produced, I is labour input and K is fixed capital input (K-5). Determine the average product of labour (APL) and marginal product of labour (MPL)
Kelo
yes,thank you
Shukri
Can I ask you other question?
Shukri
what is monopoly mean?
Habtamu Reply
What is different between quantity demand and demand?
Shukri Reply
Quantity demanded refers to the specific amount of a good or service that consumers are willing and able to purchase at a give price and within a specific time period. Demand, on the other hand, is a broader concept that encompasses the entire relationship between price and quantity demanded
Ezea
ok
Shukri
how do you save a country economic situation when it's falling apart
Lilia Reply
what is the difference between economic growth and development
Fiker Reply
Economic growth as an increase in the production and consumption of goods and services within an economy.but Economic development as a broader concept that encompasses not only economic growth but also social & human well being.
Shukri
production function means
Jabir
What do you think is more important to focus on when considering inequality ?
Abdisa Reply
any question about economics?
Awais Reply
sir...I just want to ask one question... Define the term contract curve? if you are free please help me to find this answer 🙏
Asui
it is a curve that we get after connecting the pareto optimal combinations of two consumers after their mutually beneficial trade offs
Awais
thank you so much 👍 sir
Asui
In economics, the contract curve refers to the set of points in an Edgeworth box diagram where both parties involved in a trade cannot be made better off without making one of them worse off. It represents the Pareto efficient allocations of goods between two individuals or entities, where neither p
Cornelius
In economics, the contract curve refers to the set of points in an Edgeworth box diagram where both parties involved in a trade cannot be made better off without making one of them worse off. It represents the Pareto efficient allocations of goods between two individuals or entities,
Cornelius
Suppose a consumer consuming two commodities X and Y has The following utility function u=X0.4 Y0.6. If the price of the X and Y are 2 and 3 respectively and income Constraint is birr 50. A,Calculate quantities of x and y which maximize utility. B,Calculate value of Lagrange multiplier. C,Calculate quantities of X and Y consumed with a given price. D,alculate optimum level of output .
Feyisa Reply
Answer
Feyisa
c
Jabir
the market for lemon has 10 potential consumers, each having an individual demand curve p=101-10Qi, where p is price in dollar's per cup and Qi is the number of cups demanded per week by the i th consumer.Find the market demand curve using algebra. Draw an individual demand curve and the market dema
Gsbwnw Reply
suppose the production function is given by ( L, K)=L¼K¾.assuming capital is fixed find APL and MPL. consider the following short run production function:Q=6L²-0.4L³ a) find the value of L that maximizes output b)find the value of L that maximizes marginal product
Abdureman
types of unemployment
Yomi Reply
What is the difference between perfect competition and monopolistic competition?
Mohammed
Got questions? Join the online conversation and get instant answers!
Jobilize.com Reply

Get Jobilize Job Search Mobile App in your pocket Now!

Get it on Google Play Download on the App Store Now


Source:  OpenStax, Astronomy. OpenStax CNX. Apr 12, 2017 Download for free at http://cnx.org/content/col11992/1.13
Google Play and the Google Play logo are trademarks of Google Inc.

Notification Switch

Would you like to follow the 'Astronomy' conversation and receive update notifications?

Ask