| << Chapter < Page | Chapter >> Page > |
| Characteristics of Main-Sequence Stars | ||||
|---|---|---|---|---|
| Spectral Type | Mass (Sun = 1) | Luminosity (Sun = 1) | Temperature | Radius (Sun = 1) |
| O5 | 40 | 7 × 10 5 | 40,000 K | 18 |
| B0 | 16 | 2.7 × 10 5 | 28,000 K | 7 |
| A0 | 3.3 | 55 | 10,000 K | 2.5 |
| F0 | 1.7 | 5 | 7500 K | 1.4 |
| G0 | 1.1 | 1.4 | 6000 K | 1.1 |
| K0 | 0.8 | 0.35 | 5000 K | 0.8 |
| M0 | 0.4 | 0.05 | 3500 K | 0.6 |
Note that we’ve seen this 90% figure come up before. This is exactly what we found earlier when we examined the mass-luminosity relation ( [link] ). We observed that 90% of all stars seem to follow the relationship; these are the 90% of all stars that lie on the main sequence in our H–R diagram. Our models and our observations agree.
What about the other stars on the H–R diagram—the giants and supergiants, and the white dwarfs? As we will see in the next few chapters, these are what main-sequence stars turn into as they age: They are the later stages in a star’s life. As a star consumes its nuclear fuel, its source of energy changes, as do its chemical composition and interior structure. These changes cause the star to alter its luminosity and surface temperature so that it no longer lies on the main sequence on our diagram. Because stars spend much less time in these later stages of their lives, we see fewer stars in those regions of the H–R diagram.
We can use the H–R diagram to explore the extremes in size, luminosity, and density found among the stars. Such extreme stars are not only interesting to fans of the Guinness Book of World Records ; they can teach us a lot about how stars work. For example, we saw that the most massive main-sequence stars are the most luminous ones. We know of a few extreme stars that are a million times more luminous than the Sun, with masses that exceed 100 times the Sun’s mass. These superluminous stars, which are at the upper left of the H–R diagram, are exceedingly hot, very blue stars of spectral type O. These are the stars that would be the most conspicuous at vast distances in space.
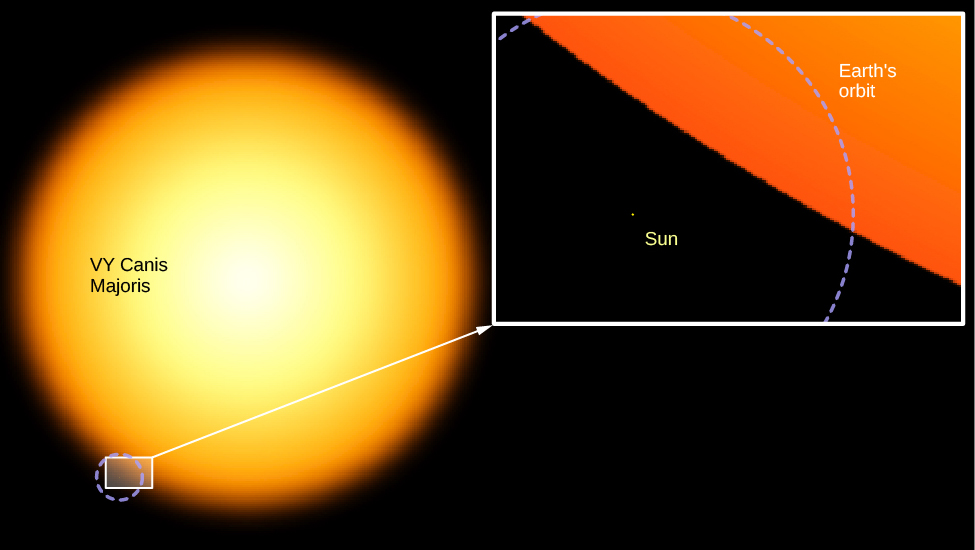
The cool supergiants in the upper corner of the H–R diagram are as much as 10,000 times as luminous as the Sun. In addition, these stars have diameters very much larger than that of the Sun. As discussed above, some supergiants are so large that if the solar system could be centered in one, the star’s surface would lie beyond the orbit of Mars (see [link] ). We will have to ask, in coming chapters, what process can make a star swell up to such an enormous size, and how long these “swollen” stars can last in their distended state.

In contrast, the very common red, cool, low-luminosity stars at the lower end of the main sequence are much smaller and more compact than the Sun. An example of such a red dwarf is Ross 614B, with a surface temperature of 2700 K and only 1/2000 of the Sun’s luminosity. We call such a star a dwarf because its diameter is only 1/10 that of the Sun. A star with such a low luminosity also has a low mass (about 1/12 that of the Sun). This combination of mass and diameter means that it is so compressed that the star has an average density about 80 times that of the Sun. Its density must be higher, in fact, than that of any known solid found on the surface of Earth. (Despite this, the star is made of gas throughout because its center is so hot.)

Notification Switch
Would you like to follow the 'Astronomy' conversation and receive update notifications?