<< Chapter < Page Chapter >> Page >

Earlier evidence

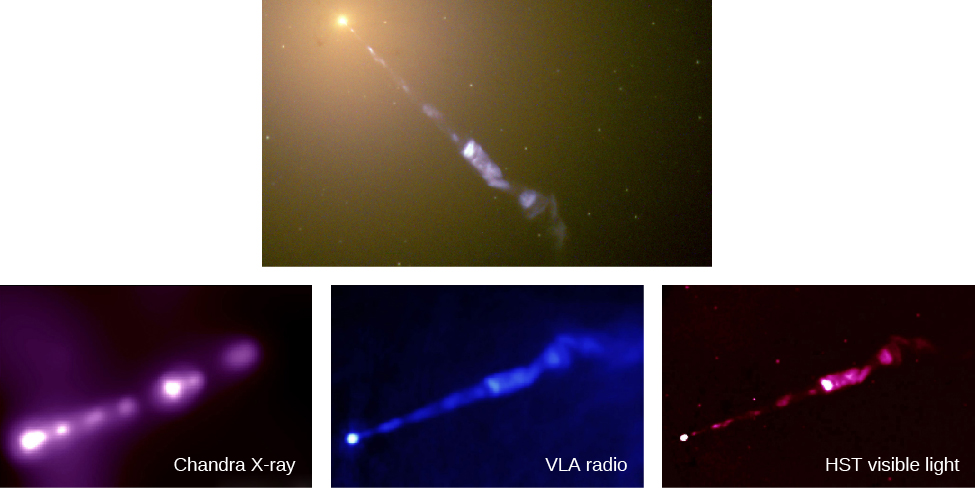
Even before the discovery of quasars, there had been hints that something very strange was going on in the centers of at least some galaxies. Back in 1918, American astronomer Heber Curtis used the large Lick Observatory telescope to photograph the galaxy Messier 87 in the constellation Virgo. On that photograph, he saw what we now call a jet coming from the center, or nucleus, of the galaxy ( [link] ). This jet literally and figuratively pointed to some strange activity going on in that galaxy nucleus. But he had no idea what it was. No one else knew what to do with this space oddity either.

The random factoid that such a central jet existed lay around for a quarter century, until Carl Seyfert , a young astronomer at Mount Wilson Observatory, also in California, found half a dozen galaxies with extremely bright nuclei that were almost stellar, rather than fuzzy in appearance like most galaxy nuclei. Using spectroscopy, he found that these nuclei contain gas moving at up to two percent the speed of light. That may not sound like much, but it is 6 million miles per hour, and more than 10 times faster than the typical motions of stars in galaxies.

M87 jet.

The M87 Jet. At top is an HST visible light image of M87 showing the huge jet of material streaming away from the bright, point-like nucleus located at upper left. The three panels at bottom show the jet at three different wavelengths. From left-to-right: image from the Chandra X-ray satellite, VLA radio image and another HST visible light image. In each image the nucleus is at lower left.
Streaming out like a cosmic searchlight from the center of the galaxy, M87 is one of nature’s most amazing phenomena, a huge jet of electrons and other particles traveling at nearly the speed of light. In this Hubble Space Telescope image, the blue of the jet contrasts with the yellow glow from the combined light of billions of unseen stars and yellow, point-like globular clusters that make up the galaxy (at the upper left). As we shall see later in this chapter, the jet, which is several thousand light-years long, originates in a disk of superheated gas swirling around a giant black hole at the center of M87. The light that we see is produced by electrons twisting along magnetic field lines in the jet, a process known as synchrotron radiation, which gives the jet its bluish tint. The jet in M87 can be observed in X-ray, radio, and visible light, as shown in the bottom three images. At the extreme left of each bottom image, we see the bright galactic nucleus harboring a supermassive black hole. (credit top: modification of work by NASA, The Hubble Heritage Team(STScI/AURA); credit bottom: modification of work by X-ray: H. Marshall (MIT), et al., CXC, NASA; Radio: F. Zhou, F. Owen (NRAO), J. Biretta (STScI); Optical: E. Perlman (UMBC), et al.)

After decades of study, astronomers identified many other strange objects beyond our Milky Way Galaxy; they populate a whole “zoo” of what are now called active galaxies    or active galactic nuclei (AGN)    . Astronomers first called them by many different names, depending on what sorts of observations discovered each category, but now we know that we are always looking at the same basic mechanism. What all these galaxies have in common is some activity in their nuclei that produces an enormous amount of energy in a very small volume of space. In the next section, we describe a model that explains all these galaxies with strong central activity—both the AGNs and the QSOs.

Key concepts and summary

The first quasars discovered looked like stars but had strong radio emission. Their visible-light spectra at first seemed confusing, but then astronomers realized that they had much larger redshifts than stars. The quasar spectra obtained so far show redshifts ranging from 15% to more than 96% the speed of light. Observations with the Hubble Space Telescope show that quasars lie at the centers of galaxies and that both spirals and ellipticals can harbor quasars. The redshifts of the underlying galaxies match the redshifts of the quasars embedded in their centers, thereby proving that quasars obey the Hubble law and are at the great distances implied by their redshifts. To be noticeable at such great distances, quasars must have 10 to 100 times the luminosity of the brighter normal galaxies. Their variations show that this tremendous energy output is generated in a small volume—in some cases, in a region not much larger than our own solar system. A number of galaxies closer to us also show strong activity at their centers—activity now known to be caused by the same mechanism as the quasars.

Questions & Answers

differentiate between demand and supply giving examples
Lambiv Reply
differentiated between demand and supply using examples
Lambiv
what is labour ?
Lambiv
how will I do?
Venny Reply
how is the graph works?I don't fully understand
Rezat Reply
information
Eliyee
devaluation
Eliyee
t
WARKISA
hi guys good evening to all
Lambiv
multiple choice question
Aster Reply
appreciation
Eliyee
explain perfect market
Lindiwe Reply
In economics, a perfect market refers to a theoretical construct where all participants have perfect information, goods are homogenous, there are no barriers to entry or exit, and prices are determined solely by supply and demand. It's an idealized model used for analysis,
Ezea
What is ceteris paribus?
Shukri Reply
other things being equal
AI-Robot
When MP₁ becomes negative, TP start to decline. Extuples Suppose that the short-run production function of certain cut-flower firm is given by: Q=4KL-0.6K2 - 0.112 • Where is quantity of cut flower produced, I is labour input and K is fixed capital input (K-5). Determine the average product of lab
Kelo
Extuples Suppose that the short-run production function of certain cut-flower firm is given by: Q=4KL-0.6K2 - 0.112 • Where is quantity of cut flower produced, I is labour input and K is fixed capital input (K-5). Determine the average product of labour (APL) and marginal product of labour (MPL)
Kelo
yes,thank you
Shukri
Can I ask you other question?
Shukri
what is monopoly mean?
Habtamu Reply
What is different between quantity demand and demand?
Shukri Reply
Quantity demanded refers to the specific amount of a good or service that consumers are willing and able to purchase at a give price and within a specific time period. Demand, on the other hand, is a broader concept that encompasses the entire relationship between price and quantity demanded
Ezea
ok
Shukri
how do you save a country economic situation when it's falling apart
Lilia Reply
what is the difference between economic growth and development
Fiker Reply
Economic growth as an increase in the production and consumption of goods and services within an economy.but Economic development as a broader concept that encompasses not only economic growth but also social & human well being.
Shukri
production function means
Jabir
What do you think is more important to focus on when considering inequality ?
Abdisa Reply
any question about economics?
Awais Reply
sir...I just want to ask one question... Define the term contract curve? if you are free please help me to find this answer 🙏
Asui
it is a curve that we get after connecting the pareto optimal combinations of two consumers after their mutually beneficial trade offs
Awais
thank you so much 👍 sir
Asui
In economics, the contract curve refers to the set of points in an Edgeworth box diagram where both parties involved in a trade cannot be made better off without making one of them worse off. It represents the Pareto efficient allocations of goods between two individuals or entities, where neither p
Cornelius
In economics, the contract curve refers to the set of points in an Edgeworth box diagram where both parties involved in a trade cannot be made better off without making one of them worse off. It represents the Pareto efficient allocations of goods between two individuals or entities,
Cornelius
Suppose a consumer consuming two commodities X and Y has The following utility function u=X0.4 Y0.6. If the price of the X and Y are 2 and 3 respectively and income Constraint is birr 50. A,Calculate quantities of x and y which maximize utility. B,Calculate value of Lagrange multiplier. C,Calculate quantities of X and Y consumed with a given price. D,alculate optimum level of output .
Feyisa Reply
Answer
Feyisa
c
Jabir
the market for lemon has 10 potential consumers, each having an individual demand curve p=101-10Qi, where p is price in dollar's per cup and Qi is the number of cups demanded per week by the i th consumer.Find the market demand curve using algebra. Draw an individual demand curve and the market dema
Gsbwnw Reply
suppose the production function is given by ( L, K)=L¼K¾.assuming capital is fixed find APL and MPL. consider the following short run production function:Q=6L²-0.4L³ a) find the value of L that maximizes output b)find the value of L that maximizes marginal product
Abdureman
types of unemployment
Yomi Reply
What is the difference between perfect competition and monopolistic competition?
Mohammed
Got questions? Join the online conversation and get instant answers!
Jobilize.com Reply
Practice Key Terms 3

Get Jobilize Job Search Mobile App in your pocket Now!

Get it on Google Play Download on the App Store Now


Source:  OpenStax, Astronomy. OpenStax CNX. Apr 12, 2017 Download for free at http://cnx.org/content/col11992/1.13
Google Play and the Google Play logo are trademarks of Google Inc.

Notification Switch

Would you like to follow the 'Astronomy' conversation and receive update notifications?

Ask