<< Chapter < Page
  Astronomy   Page 1 / 1
Chapter >> Page >

Ant nebula.

False-color Image of the Ant Nebula. This “planetary nebula” consists of a central star (located at the center of this image), bracketed on the left and right by two lobes of gaseous material. The image is colored such that red corresponds to sulfur emission, green to nitrogen, blue to hydrogen, and blue/violet to oxygen.
During the later phases of stellar evolution, stars expel some of their mass, which returns to the interstellar medium to form new stars. This Hubble Space Telescope image shows a star losing mass. Known as Menzel 3, or the Ant Nebula , this beautiful region of expelled gas is about 3000 light-years away from the Sun. We see a central star that has ejected mass preferentially in two opposite directions. The object is about 1.6 light-years long. The image is color coded—red corresponds to an emission line of sulfur, green to nitrogen, blue to hydrogen, and blue/violet to oxygen. (credit: modification of work by NASA, ESA and The Hubble Heritage Team (STScI/AURA))

The Sun and other stars cannot last forever. Eventually they will exhaust their nuclear fuel and cease to shine. But how do they change during their long lifetimes? And what do these changes mean for the future of Earth?

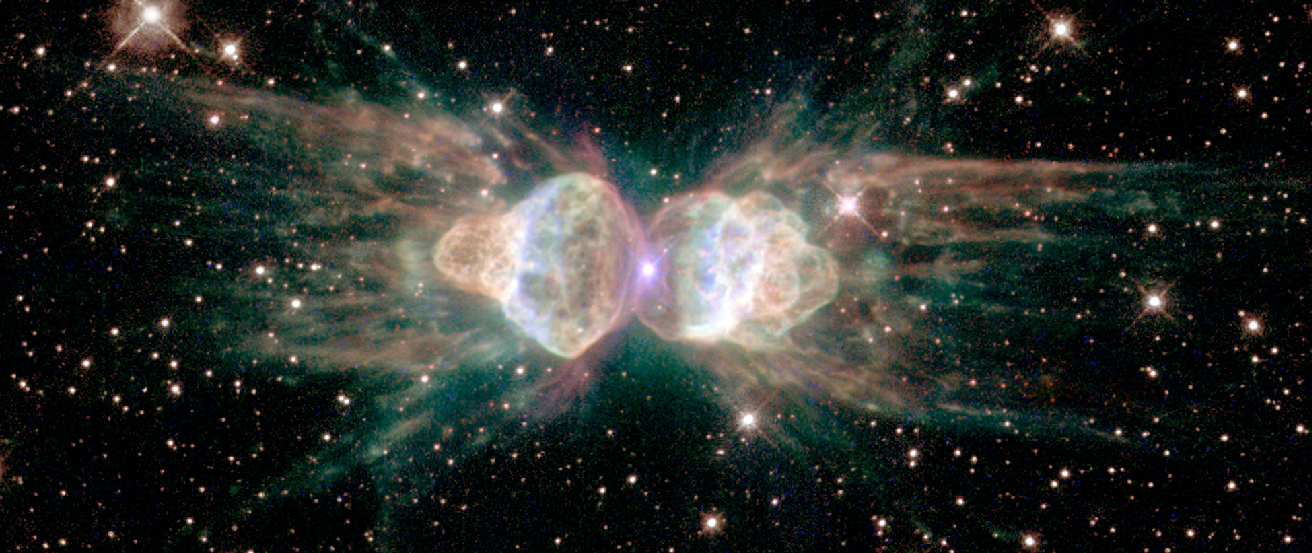
We now turn from the birth of stars to the rest of their life stories. This is not an easy task since stars live much longer than astronomers. Thus, we cannot hope to see the life story of any single star unfold before our eyes or telescopes. To learn about their lives, we must survey as many of the stellar inhabitants of the Galaxy as possible. With thoroughness and a little luck, we can catch at least a few of them in each stage of their lives. As you’ve learned, stars have many different characteristics, with the differences sometimes resulting from their different masses, temperatures, and luminosities, and at other times derived from changes that occur as they age. Through a combination of observation and theory, we can use these differences to piece together the life story of a star.

Questions & Answers

how do you get the 2/50
Abba Reply
number of sport play by 50 student construct discrete data
Aminu Reply
width of the frangebany leaves on how to write a introduction
Theresa Reply
Solve the mean of variance
Veronica Reply
Step 1: Find the mean. To find the mean, add up all the scores, then divide them by the number of scores. ... Step 2: Find each score's deviation from the mean. ... Step 3: Square each deviation from the mean. ... Step 4: Find the sum of squares. ... Step 5: Divide the sum of squares by n – 1 or N.
kenneth
what is error
Yakuba Reply
Is mistake done to something
Vutshila
Hy
anas
hy
What is the life teble
anas
hy
Jibrin
statistics is the analyzing of data
Tajudeen Reply
what is statics?
Zelalem Reply
how do you calculate mean
Gloria Reply
diveving the sum if all values
Shaynaynay
let A1,A2 and A3 events be independent,show that (A1)^c, (A2)^c and (A3)^c are independent?
Fisaye Reply
what is statistics
Akhisani Reply
data collected all over the world
Shaynaynay
construct a less than and more than table
Imad Reply
The sample of 16 students is taken. The average age in the sample was 22 years with astandard deviation of 6 years. Construct a 95% confidence interval for the age of the population.
Aschalew Reply
Bhartdarshan' is an internet-based travel agency wherein customer can see videos of the cities they plant to visit. The number of hits daily is a normally distributed random variable with a mean of 10,000 and a standard deviation of 2,400 a. what is the probability of getting more than 12,000 hits? b. what is the probability of getting fewer than 9,000 hits?
Akshay Reply
Bhartdarshan'is an internet-based travel agency wherein customer can see videos of the cities they plan to visit. The number of hits daily is a normally distributed random variable with a mean of 10,000 and a standard deviation of 2,400. a. What is the probability of getting more than 12,000 hits
Akshay
1
Bright
Sorry i want to learn more about this question
Bright
Someone help
Bright
a= 0.20233 b=0.3384
Sufiyan
a
Shaynaynay
How do I interpret level of significance?
Mohd Reply
It depends on your business problem or in Machine Learning you could use ROC- AUC cruve to decide the threshold value
Shivam
how skewness and kurtosis are used in statistics
Owen Reply
yes what is it
Taneeya
Got questions? Join the online conversation and get instant answers!
Jobilize.com Reply

Get Jobilize Job Search Mobile App in your pocket Now!

Get it on Google Play Download on the App Store Now


Source:  OpenStax, Astronomy. OpenStax CNX. Apr 12, 2017 Download for free at http://cnx.org/content/col11992/1.13
Google Play and the Google Play logo are trademarks of Google Inc.

Notification Switch

Would you like to follow the 'Astronomy' conversation and receive update notifications?

Ask