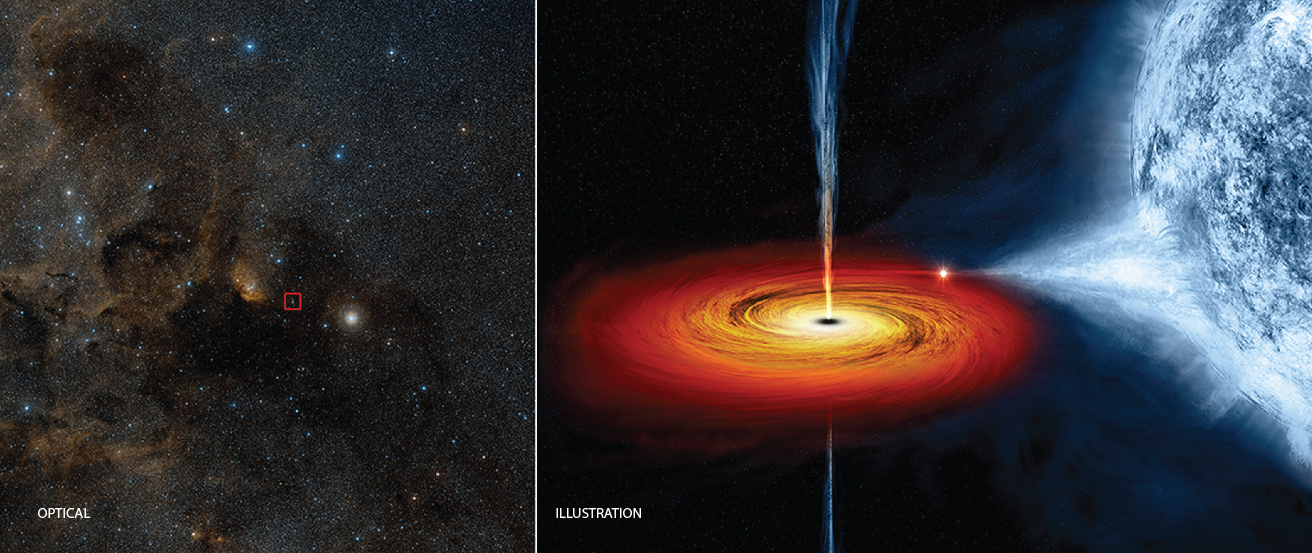
On the left, a visible-light image shows a region of the sky in the constellation of Cygnus; the red box marks the position of the X-ray source
Cygnus X-1 . It is an example of a black hole created when a massive star collapses at the end of its life. Cygnus X-1 is in a binary star system, and the artist’s illustration on the right shows the black hole pulling material away from a massive blue companion star. This material forms a disk (shown in red and orange) that rotates around the black hole before falling into it or being redirected away from the black hole in the form of powerful jets. The material in the disk (before it falls into the black hole) is so hot that it glows with X-rays, explaining why this object is an X-ray source. (credit left: modification of work by DSS; credit right: modification of work by NASA/CXC/M.Weiss)
For most of the twentieth century, black holes seemed the stuff of science fiction, portrayed either as monster vacuum cleaners consuming all the matter around them or as tunnels from one universe to another. But the truth about black holes is almost stranger than fiction. As we continue our voyage into the universe, we will discover that black holes are the key to explaining many mysterious and remarkable objects—including collapsed stars and the active centers of giant galaxies.
Step 1: Find the mean. To find the mean, add up all the scores, then divide them by the number of scores. ...
Step 2: Find each score's deviation from the mean. ...
Step 3: Square each deviation from the mean. ...
Step 4: Find the sum of squares. ...
Step 5: Divide the sum of squares by n – 1 or N.
The sample of 16 students is taken. The average age in the sample was 22 years with astandard deviation of 6 years. Construct a 95% confidence interval for the age of the population.
Bhartdarshan' is an internet-based travel agency wherein customer can see videos of the cities they plant to visit. The number of hits daily is a normally distributed random variable with a mean of 10,000 and a standard deviation of 2,400
a. what is the probability of getting more than 12,000 hits?
b. what is the probability of getting fewer than 9,000 hits?
Bhartdarshan'is an internet-based travel agency wherein customer can see videos of the cities they plan to visit. The number of hits daily is a normally distributed random variable with a mean of 10,000 and a standard deviation of 2,400.
a. What is the probability of getting more than 12,000 hits