<< Chapter < Page Chapter >> Page >

Learning objectives

By the end of this section, you will be able to:

  • Differentiate between Earth’s various atmospheric layers
  • Describe the chemical composition and possible origins of our atmosphere
  • Explain the difference between weather and climate

We live at the bottom of the ocean of air that envelops our planet. The atmosphere, weighing down upon Earth ’s surface under the force of gravity, exerts a pressure at sea level that scientists define as 1 bar    (a term that comes from the same root as barometer , an instrument used to measure atmospheric pressure). A bar of pressure means that each square centimeter of Earth’s surface has a weight equivalent to 1.03 kilograms pressing down on it. Humans have evolved to live at this pressure; make the pressure a lot lower or higher and we do not function well.

The total mass of Earth’s atmosphere is about 5 × 10 18 kilograms. This sounds like a large number, but it is only about a millionth of the total mass of Earth. The atmosphere represents a smaller fraction of Earth than the fraction of your mass represented by the hair on your head.

Structure of the atmosphere

The structure of the atmosphere is illustrated in [link] . Most of the atmosphere is concentrated near the surface of Earth, within about the bottom 10 kilometers where clouds form and airplanes fly. Within this region—called the troposphere    —warm air, heated by the surface, rises and is replaced by descending currents of cooler air; this is an example of convection. This circulation generates clouds and wind. Within the troposphere, temperature decreases rapidly with increasing elevation to values near 50 °C below freezing at its upper boundary, where the stratosphere    begins. Most of the stratosphere, which extends to about 50 kilometers above the surface, is cold and free of clouds.

Structure of earth’s atmosphere.

Illustration of the Structure of Earth’s Atmosphere. At left is a vertical scale in kilometers, ranging from zero at bottom to 130 km, in increments of 10. The horizontal scale is temperature in degrees Kelvin, ranging from zero at left to 500 on the right, in increments of 100. At far right the atmospheric layers are indicated. The troposphere is at the bottom, with H2O clouds at about 20 km, the stratosphere near 40 km, the mesosphere begins near 90 km, and finally the ionosphere is at top at 130 km. In the center of the diagram a red line is drawn to indicate the change of temperature with altitude. At the surface the line begins at 300 K, the line curves left as it rises to a low of about 190 K at 30 km, where molecules of N2 and O2 are shown. The temperature rises again with altitude to near 250 K at 60 km where the ozone layer is labeled. The temperature again falls with height, to 190 K at 100 km. At this altitude, meteors burn up as they penetrate the atmosphere. Finally, the temperature rises again with height, to just over 300 K at the top of the figure at 130 km.
Height increases up the left side of the diagram, and the names of the different atmospheric layers are shown at the right. In the upper ionosphere, ultraviolet radiation from the Sun can strip electrons from their atoms, leaving the atmosphere ionized. The curving red line shows the temperature (see the scale on the x -axis).

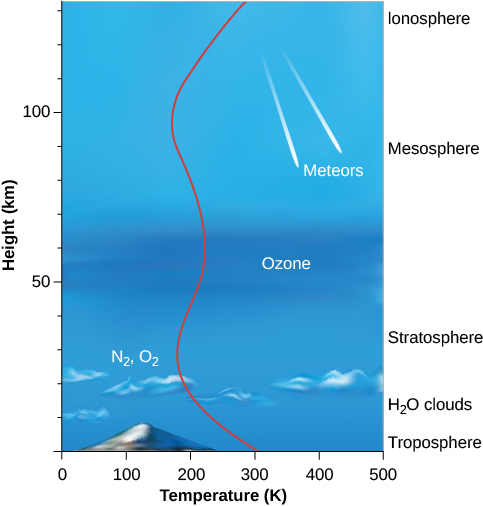
Near the top of the stratosphere is a layer of ozone    (O 3 ), a heavy form of oxygen with three atoms per molecule instead of the usual two. Because ozone is a good absorber of ultraviolet light, it protects the surface from some of the Sun’s dangerous ultraviolet radiation, making it possible for life to exist on Earth. The breakup of ozone adds heat to the stratosphere, reversing the decreasing temperature trend in the troposphere. Because ozone is essential to our survival, we reacted with justifiable concern to evidence that became clear in the 1980s that atmospheric ozone was being destroyed by human activities. By international agreement, the production of industrial chemicals that cause ozone depletion, called chlorofluorocarbons, or CFCs, has been phased out. As a result, ozone loss has stopped and the “ozone hole” over the Antarctic is shrinking gradually. This is an example of how concerted international action can help maintain the habitability of Earth.

Questions & Answers

how do you get the 2/50
Abba Reply
number of sport play by 50 student construct discrete data
Aminu Reply
width of the frangebany leaves on how to write a introduction
Theresa Reply
Solve the mean of variance
Veronica Reply
Step 1: Find the mean. To find the mean, add up all the scores, then divide them by the number of scores. ... Step 2: Find each score's deviation from the mean. ... Step 3: Square each deviation from the mean. ... Step 4: Find the sum of squares. ... Step 5: Divide the sum of squares by n – 1 or N.
kenneth
what is error
Yakuba Reply
Is mistake done to something
Vutshila
Hy
anas
hy
What is the life teble
anas
hy
Jibrin
statistics is the analyzing of data
Tajudeen Reply
what is statics?
Zelalem Reply
how do you calculate mean
Gloria Reply
diveving the sum if all values
Shaynaynay
let A1,A2 and A3 events be independent,show that (A1)^c, (A2)^c and (A3)^c are independent?
Fisaye Reply
what is statistics
Akhisani Reply
data collected all over the world
Shaynaynay
construct a less than and more than table
Imad Reply
The sample of 16 students is taken. The average age in the sample was 22 years with astandard deviation of 6 years. Construct a 95% confidence interval for the age of the population.
Aschalew Reply
Bhartdarshan' is an internet-based travel agency wherein customer can see videos of the cities they plant to visit. The number of hits daily is a normally distributed random variable with a mean of 10,000 and a standard deviation of 2,400 a. what is the probability of getting more than 12,000 hits? b. what is the probability of getting fewer than 9,000 hits?
Akshay Reply
Bhartdarshan'is an internet-based travel agency wherein customer can see videos of the cities they plan to visit. The number of hits daily is a normally distributed random variable with a mean of 10,000 and a standard deviation of 2,400. a. What is the probability of getting more than 12,000 hits
Akshay
1
Bright
Sorry i want to learn more about this question
Bright
Someone help
Bright
a= 0.20233 b=0.3384
Sufiyan
a
Shaynaynay
How do I interpret level of significance?
Mohd Reply
It depends on your business problem or in Machine Learning you could use ROC- AUC cruve to decide the threshold value
Shivam
how skewness and kurtosis are used in statistics
Owen Reply
yes what is it
Taneeya
Got questions? Join the online conversation and get instant answers!
Jobilize.com Reply
Practice Key Terms 4

Get Jobilize Job Search Mobile App in your pocket Now!

Get it on Google Play Download on the App Store Now


Source:  OpenStax, Astronomy. OpenStax CNX. Apr 12, 2017 Download for free at http://cnx.org/content/col11992/1.13
Google Play and the Google Play logo are trademarks of Google Inc.

Notification Switch

Would you like to follow the 'Astronomy' conversation and receive update notifications?

Ask