<< Chapter < Page Chapter >> Page >

Hubble’s law.

Hubble’s Law. The plot in panel (a), at left, is labeled “Hubble’s Data (1929)” and has the vertical axis labeled “Velocity (km/s)”, running from -500 at bottom to 1500 at top in increments of 500 km/s. The horizontal axis is labeled “Distance (millions of LY)”, and runs from zero at left to 6 at right in increments of 3 million light years. The data is plotted as red dots, with the mean drawn as a red line beginning at 0 LY, 0 km/s at lower left to 6 MLY, 1000 km/s at upper right. The plot in panel (b), at right, is labeled “Hubble and Humason (1931)” and has the vertical axis labeled “Velocity (km/s)”, running from zero at bottom to 20,000 at top in increments of 5,000 km/s. The horizontal axis is labeled “Distance (millions of LY)”, and runs from zero at left to 120 at right in increments of 30 million LY. The data is plotted as black dots, with the mean drawn as a black line beginning at 0 LY, 0 km/s at lower left to 100 MLY, 19,000 km/s at upper right. The data from panel (a) are plotted in red at lower left.
(a) These data show Hubble’s original velocity-distance relation, adapted from his 1929 paper in the Proceedings of the National Academy of Sciences . (b) These data show Hubble and Humason’s velocity-distance relation, adapted from their 1931 paper in The Astrophysical Journal . The red dots at the lower left are the points in the diagram in the 1929 paper. Comparison of the two graphs shows how rapidly the determination of galactic distances and redshifts progressed in the 2 years between these publications.

We now know that this relationship holds for every galaxy except a few of the nearest ones. Nearly all of the galaxies that are approaching us turn out to be part of the Milky Way’s own group of galaxies, which have their own individual motions, just as birds flying in a group may fly in slightly different directions at slightly different speeds even though the entire flock travels through space together.

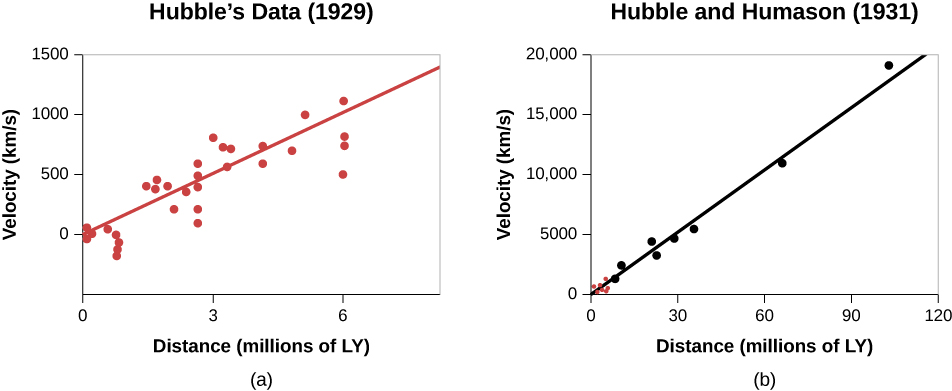
Written as a formula, the relationship between velocity and distance is

V = H × d

where v is the recession speed, d is the distance, and H is a number called the Hubble constant    . This equation is now known as Hubble’s law    .

Constants of proportionality

Mathematical relationships such as Hubble’s law are pretty common in life. To take a simple example, suppose your college or university hires you to call rich alumni and ask for donations. You are paid $2.50 for each call; the more calls you can squeeze in between studying astronomy and other courses, the more money you take home. We can set up a formula that connects p , your pay, and n , the number of calls

p = A × n

where A is the alumni constant, with a value of $2.50. If you make 20 calls, you will earn $2.50 times 20, or $50.

Suppose your boss forgets to tell you what you will get paid for each call. You can calculate the alumni constant that governs your pay by keeping track of how many calls you make and noting your gross pay each week. If you make 100 calls the first week and are paid $250, you can deduce that the constant is $2.50 (in units of dollars per call). Hubble, of course, had no “boss” to tell him what his constant would be—he had to calculate its value from the measurements of distance and velocity.

Astronomers express the value of Hubble’s constant in units that relate to how they measure speed and velocity for galaxies. In this book, we will use kilometers per second per million light-years as that unit. For many years, estimates of the value of the Hubble constant have been in the range of 15 to 30 kilometers per second per million light-years The most recent work appears to be converging on a value near 22 kilometers per second per million light-years If H is 22 kilometers per second per million light-years, a galaxy moves away from us at a speed of 22 kilometers per second for every million light-years of its distance. As an example, a galaxy 100 million light-years away is moving away from us at a speed of 2200 kilometers per second.

Hubble’s law tells us something fundamental about the universe. Since all but the nearest galaxies appear to be in motion away from us, with the most distant ones moving the fastest, we must be living in an expanding universe. We will explore the implications of this idea shortly, as well as in the final chapters of this text. For now, we will just say that Hubble’s observation underlies all our theories about the origin and evolution of the universe.

Questions & Answers

What are the factors that affect demand for a commodity
Florence Reply
differentiate between demand and supply giving examples
Lambiv Reply
differentiated between demand and supply using examples
Lambiv
what is labour ?
Lambiv
how will I do?
Venny Reply
how is the graph works?I don't fully understand
Rezat Reply
information
Eliyee
devaluation
Eliyee
t
WARKISA
hi guys good evening to all
Lambiv
multiple choice question
Aster Reply
appreciation
Eliyee
explain perfect market
Lindiwe Reply
In economics, a perfect market refers to a theoretical construct where all participants have perfect information, goods are homogenous, there are no barriers to entry or exit, and prices are determined solely by supply and demand. It's an idealized model used for analysis,
Ezea
What is ceteris paribus?
Shukri Reply
other things being equal
AI-Robot
When MP₁ becomes negative, TP start to decline. Extuples Suppose that the short-run production function of certain cut-flower firm is given by: Q=4KL-0.6K2 - 0.112 • Where is quantity of cut flower produced, I is labour input and K is fixed capital input (K-5). Determine the average product of lab
Kelo
Extuples Suppose that the short-run production function of certain cut-flower firm is given by: Q=4KL-0.6K2 - 0.112 • Where is quantity of cut flower produced, I is labour input and K is fixed capital input (K-5). Determine the average product of labour (APL) and marginal product of labour (MPL)
Kelo
yes,thank you
Shukri
Can I ask you other question?
Shukri
what is monopoly mean?
Habtamu Reply
What is different between quantity demand and demand?
Shukri Reply
Quantity demanded refers to the specific amount of a good or service that consumers are willing and able to purchase at a give price and within a specific time period. Demand, on the other hand, is a broader concept that encompasses the entire relationship between price and quantity demanded
Ezea
ok
Shukri
how do you save a country economic situation when it's falling apart
Lilia Reply
what is the difference between economic growth and development
Fiker Reply
Economic growth as an increase in the production and consumption of goods and services within an economy.but Economic development as a broader concept that encompasses not only economic growth but also social & human well being.
Shukri
production function means
Jabir
What do you think is more important to focus on when considering inequality ?
Abdisa Reply
any question about economics?
Awais Reply
sir...I just want to ask one question... Define the term contract curve? if you are free please help me to find this answer 🙏
Asui
it is a curve that we get after connecting the pareto optimal combinations of two consumers after their mutually beneficial trade offs
Awais
thank you so much 👍 sir
Asui
In economics, the contract curve refers to the set of points in an Edgeworth box diagram where both parties involved in a trade cannot be made better off without making one of them worse off. It represents the Pareto efficient allocations of goods between two individuals or entities, where neither p
Cornelius
In economics, the contract curve refers to the set of points in an Edgeworth box diagram where both parties involved in a trade cannot be made better off without making one of them worse off. It represents the Pareto efficient allocations of goods between two individuals or entities,
Cornelius
Suppose a consumer consuming two commodities X and Y has The following utility function u=X0.4 Y0.6. If the price of the X and Y are 2 and 3 respectively and income Constraint is birr 50. A,Calculate quantities of x and y which maximize utility. B,Calculate value of Lagrange multiplier. C,Calculate quantities of X and Y consumed with a given price. D,alculate optimum level of output .
Feyisa Reply
Answer
Feyisa
c
Jabir
the market for lemon has 10 potential consumers, each having an individual demand curve p=101-10Qi, where p is price in dollar's per cup and Qi is the number of cups demanded per week by the i th consumer.Find the market demand curve using algebra. Draw an individual demand curve and the market dema
Gsbwnw Reply
suppose the production function is given by ( L, K)=L¼K¾.assuming capital is fixed find APL and MPL. consider the following short run production function:Q=6L²-0.4L³ a) find the value of L that maximizes output b)find the value of L that maximizes marginal product
Abdureman
Got questions? Join the online conversation and get instant answers!
Jobilize.com Reply

Get Jobilize Job Search Mobile App in your pocket Now!

Get it on Google Play Download on the App Store Now


Source:  OpenStax, Astronomy. OpenStax CNX. Apr 12, 2017 Download for free at http://cnx.org/content/col11992/1.13
Google Play and the Google Play logo are trademarks of Google Inc.

Notification Switch

Would you like to follow the 'Astronomy' conversation and receive update notifications?

Ask