<< Chapter < Page Chapter >> Page >

Learning objectives

By the end of this section, you will be able to:

  • Describe the discovery that galaxies getting farther apart as the universe evolves
  • Explain how to use Hubble’s law to determine distances to remote galaxies
  • Describe models for the nature of an expanding universe
  • Explain the variation in Hubble’s constant

We now come to one of the most important discoveries ever made in astronomy—the fact that the universe is expanding. Before we describe how the discovery was made, we should point out that the first steps in the study of galaxies came at a time when the techniques of spectroscopy were also making great strides. Astronomers using large telescopes could record the spectrum of a faint star or galaxy on photographic plates, guiding their telescopes so they remained pointed to the same object for many hours and collected more light. The resulting spectra of galaxies contained a wealth of information about the composition of the galaxy and the velocities of these great star systems.

Slipher’s pioneering observations

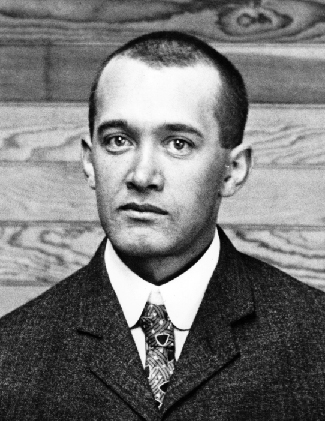
Curiously, the discovery of the expansion of the universe began with the search for Martians and other solar systems. In 1894, the controversial (and wealthy) astronomer Percival Lowell established an observatory in Flagstaff, Arizona, to study the planets and search for life in the universe. Lowell thought that the spiral nebulae might be solar systems in the process of formation. He therefore asked one of the observatory’s young astronomers, Vesto M. Slipher ( [link] ), to photograph the spectra of some of the spiral nebulae to see if their spectral lines might show chemical compositions like those expected for newly forming planets.

Vesto m. slipher (1875–1969).

Photograph of Vesto M. Slipher.
Slipher spent his entire career at the Lowell Observatory, where he discovered the large radial velocities of galaxies. (credit: Lowell Observatory)

The Lowell Observatory’s major instrument was a 24-inch refracting telescope, which was not at all well suited to observations of faint spiral nebulae. With the technology available in those days, photographic plates had to be exposed for 20 to 40 hours to produce a good spectrum (in which the positions of the lines could reveal a galaxy’s motion). This often meant continuing to expose the same photograph over several nights. Beginning in 1912, and making heroic efforts over a period of about 20 years, Slipher managed to photograph the spectra of more than 40 of the spiral nebulae (which would all turn out to be galaxies).

To his surprise, the spectral lines of most galaxies showed an astounding redshift    . By “redshift” we mean that the lines in the spectra are displaced toward longer wavelengths (toward the red end of the visible spectrum). Recall from the chapter on Radiation and Spectra that a redshift is seen when the source of the waves is moving away from us. Slipher’s observations showed that most spirals are racing away at huge speeds; the highest velocity he measured was 1800 kilometers per second.

Only a few spirals—such as the Andromeda and Triangulum Galaxies and M81—all of which are now known to be our close neighbors, turned out to be approaching us. All the other galaxies were moving away. Slipher first announced this discovery in 1914, years before Hubble showed that these objects were other galaxies and before anyone knew how far away they were. No one at the time quite knew what to make of this discovery.

Questions & Answers

how do you get the 2/50
Abba Reply
number of sport play by 50 student construct discrete data
Aminu Reply
width of the frangebany leaves on how to write a introduction
Theresa Reply
Solve the mean of variance
Veronica Reply
Step 1: Find the mean. To find the mean, add up all the scores, then divide them by the number of scores. ... Step 2: Find each score's deviation from the mean. ... Step 3: Square each deviation from the mean. ... Step 4: Find the sum of squares. ... Step 5: Divide the sum of squares by n – 1 or N.
kenneth
what is error
Yakuba Reply
Is mistake done to something
Vutshila
Hy
anas
hy
What is the life teble
anas
hy
Jibrin
statistics is the analyzing of data
Tajudeen Reply
what is statics?
Zelalem Reply
how do you calculate mean
Gloria Reply
diveving the sum if all values
Shaynaynay
let A1,A2 and A3 events be independent,show that (A1)^c, (A2)^c and (A3)^c are independent?
Fisaye Reply
what is statistics
Akhisani Reply
data collected all over the world
Shaynaynay
construct a less than and more than table
Imad Reply
The sample of 16 students is taken. The average age in the sample was 22 years with astandard deviation of 6 years. Construct a 95% confidence interval for the age of the population.
Aschalew Reply
Bhartdarshan' is an internet-based travel agency wherein customer can see videos of the cities they plant to visit. The number of hits daily is a normally distributed random variable with a mean of 10,000 and a standard deviation of 2,400 a. what is the probability of getting more than 12,000 hits? b. what is the probability of getting fewer than 9,000 hits?
Akshay Reply
Bhartdarshan'is an internet-based travel agency wherein customer can see videos of the cities they plan to visit. The number of hits daily is a normally distributed random variable with a mean of 10,000 and a standard deviation of 2,400. a. What is the probability of getting more than 12,000 hits
Akshay
1
Bright
Sorry i want to learn more about this question
Bright
Someone help
Bright
a= 0.20233 b=0.3384
Sufiyan
a
Shaynaynay
How do I interpret level of significance?
Mohd Reply
It depends on your business problem or in Machine Learning you could use ROC- AUC cruve to decide the threshold value
Shivam
how skewness and kurtosis are used in statistics
Owen Reply
yes what is it
Taneeya
Got questions? Join the online conversation and get instant answers!
Jobilize.com Reply

Get Jobilize Job Search Mobile App in your pocket Now!

Get it on Google Play Download on the App Store Now


Source:  OpenStax, Astronomy. OpenStax CNX. Apr 12, 2017 Download for free at http://cnx.org/content/col11992/1.13
Google Play and the Google Play logo are trademarks of Google Inc.

Notification Switch

Would you like to follow the 'Astronomy' conversation and receive update notifications?

Ask