<< Chapter < Page Chapter >> Page >

Learning objectives

By the end of this section, you will be able to:

  • Describe the roles played by the collapse of a single cloud and mergers with other galaxies in building the Milky Way Galaxy we see today
  • Provide examples of globular clusters and satellite galaxies affected by the Milky Way’s strong gravity.

Information about stellar populations holds vital clues to how our Galaxy was built up over time. The flattened disk shape of the Galaxy suggests that it formed through a process similar to the one that leads to the formation of a protostar (see The Birth of Stars and the Discovery of Planets outside the Solar System ). Building on this idea, astronomers first developed models that assumed the Galaxy formed from a single rotating cloud. But, as we shall see, this turns out to be only part of the story.

The protogalactic cloud and the monolithic collapse model

Because the oldest stars—those in the halo and in globular clusters—are distributed in a sphere centered on the nucleus of the Galaxy, it makes sense to assume that the protogalactic cloud that gave birth to our Galaxy was roughly spherical. The oldest stars in the halo have ages of 12 to 13 billion years, so we estimate that the formation of the Galaxy began about that long ago. (See the chapter on The Big Bang for other evidence that galaxies in general began forming a little more than 13 billion years ago.) Then, just as in the case of star formation, the protogalactic cloud collapsed and formed a thin rotating disk. Stars born before the cloud collapsed did not participate in the collapse, but have continued to orbit in the halo to the present day ( [link] ).

Monolithic collapse model for the formation of the galaxy.

Monolithic Collapse Model for the Formation of the Galaxy. Panel 1 at upper left shows the gas cloud, drawn as a blue blob, at the beginning of its collapse. The axis of rotation (drawn in all four panels) is a vertical line above center with a counter-clockwise arrow around it indicating the direction of rotation. White arrows at the periphery of the cloud point toward the center illustrating the collapse. Panel 2 at upper right shows the gas cloud flattened a bit at the edges and thicker nearer the axis of rotation. Globular clusters are indicated as white dots outside the cloud. Panel 3 at lower left shows the cloud further flattened and continuing to collapse into a disk. Finally, panel 4 at lower right shows the galaxy much thinner, and now drawn in white to indicate that stars have formed in the disk. Globular clusters are evenly distributed around the galactic bulge.
According to this model, the Milky Way Galaxy initially formed from a rotating cloud of gas that collapsed due to gravity. Halo stars and globular clusters either formed prior to the collapse or were formed elsewhere. Stars in the disk formed later, when the gas from which they were made was already “contaminated” with heavy elements produced in earlier generations of stars.

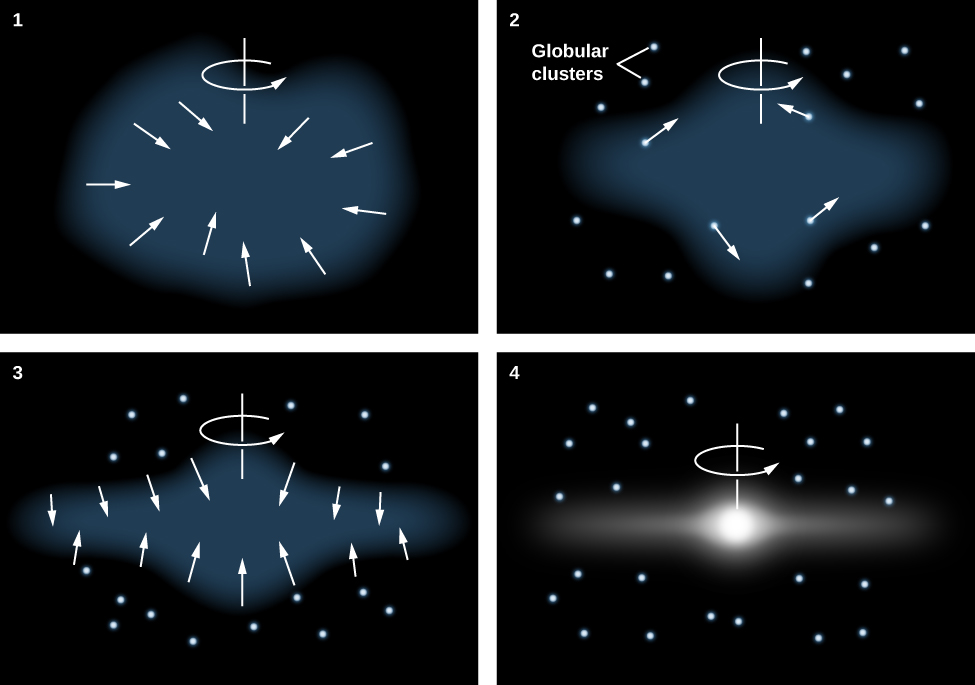
Gravitational forces caused the gas in the thin disk to fragment into clouds or clumps with masses like those of star clusters. These individual clouds then fragmented further to form stars. Since the oldest stars in the disk are nearly as old as the youngest stars in the halo, the collapse must have been rapid (astronomically speaking), requiring perhaps no more than a few hundred million years.

Collision victims and the multiple merger model

In past decades, astronomers have learned that the evolution of the Galaxy has not been quite as peaceful as this monolithic collapse model suggests. In 1994, astronomers discovered a small new galaxy in the direction of the constellation of Sagittarius. The Sagittarius dwarf galaxy is currently about 70,000 light-years away from Earth and 50,000 light-years from the center of the Galaxy. It is the closest galaxy known ( [link] ). It is very elongated, and its shape indicates that it is being torn apart by our Galaxy’s gravitational tides—just as Comet Shoemaker-Levy 9 was torn apart when it passed too close to Jupiter in 1992.

Questions & Answers

how do you get the 2/50
Abba Reply
number of sport play by 50 student construct discrete data
Aminu Reply
width of the frangebany leaves on how to write a introduction
Theresa Reply
Solve the mean of variance
Veronica Reply
Step 1: Find the mean. To find the mean, add up all the scores, then divide them by the number of scores. ... Step 2: Find each score's deviation from the mean. ... Step 3: Square each deviation from the mean. ... Step 4: Find the sum of squares. ... Step 5: Divide the sum of squares by n – 1 or N.
kenneth
what is error
Yakuba Reply
Is mistake done to something
Vutshila
Hy
anas
hy
What is the life teble
anas
hy
Jibrin
statistics is the analyzing of data
Tajudeen Reply
what is statics?
Zelalem Reply
how do you calculate mean
Gloria Reply
diveving the sum if all values
Shaynaynay
let A1,A2 and A3 events be independent,show that (A1)^c, (A2)^c and (A3)^c are independent?
Fisaye Reply
what is statistics
Akhisani Reply
data collected all over the world
Shaynaynay
construct a less than and more than table
Imad Reply
The sample of 16 students is taken. The average age in the sample was 22 years with astandard deviation of 6 years. Construct a 95% confidence interval for the age of the population.
Aschalew Reply
Bhartdarshan' is an internet-based travel agency wherein customer can see videos of the cities they plant to visit. The number of hits daily is a normally distributed random variable with a mean of 10,000 and a standard deviation of 2,400 a. what is the probability of getting more than 12,000 hits? b. what is the probability of getting fewer than 9,000 hits?
Akshay Reply
Bhartdarshan'is an internet-based travel agency wherein customer can see videos of the cities they plan to visit. The number of hits daily is a normally distributed random variable with a mean of 10,000 and a standard deviation of 2,400. a. What is the probability of getting more than 12,000 hits
Akshay
1
Bright
Sorry i want to learn more about this question
Bright
Someone help
Bright
a= 0.20233 b=0.3384
Sufiyan
a
Shaynaynay
How do I interpret level of significance?
Mohd Reply
It depends on your business problem or in Machine Learning you could use ROC- AUC cruve to decide the threshold value
Shivam
how skewness and kurtosis are used in statistics
Owen Reply
yes what is it
Taneeya
Got questions? Join the online conversation and get instant answers!
Jobilize.com Reply

Get Jobilize Job Search Mobile App in your pocket Now!

Get it on Google Play Download on the App Store Now


Source:  OpenStax, Astronomy. OpenStax CNX. Apr 12, 2017 Download for free at http://cnx.org/content/col11992/1.13
Google Play and the Google Play logo are trademarks of Google Inc.

Notification Switch

Would you like to follow the 'Astronomy' conversation and receive update notifications?

Ask