<< Chapter < Page Chapter >> Page >

Some key stages of evolution of the star that became SN 1987A, including the ones following helium exhaustion, are listed in [link] . While we don’t expect you to remember these numbers, note the patterns in the table: each stage of evolution happens more quickly than the preceding one, the temperature and pressure in the core increase, and progressively heavier elements are the source of fusion energy. Once iron was created, the collapse began. It was a catastrophic collapse, lasting only a few tenths of a second; the speed of infall in the outer portion of the iron core reached 70,000 kilometers per second, about one-fourth the speed of light.

Evolution of the Star That Exploded as SN 1987A
Phase Central Temperature (K) Central Density (g/cm 3 ) Time Spent in This Phase
Hydrogen fusion 40 × 10 6 5 8 × 10 6 years
Helium fusion 190 × 10 6 970 10 6 years
Carbon fusion 870 × 10 6 170,000 2000 years
Neon fusion 1.6 × 10 9 3.0 × 10 6 6 months
Oxygen fusion 2.0 × 10 9 5.6 × 10 6 1 year
Silicon fusion 3.3 × 10 9 4.3 × 10 7 Days
Core collapse 200 × 10 9 2 × 10 14 Tenths of a second

In the meantime, as the core was experiencing its last catastrophe, the outer shells of neon, oxygen, carbon, helium, and hydrogen in the star did not yet know about the collapse. Information about the physical movement of different layers travels through a star at the speed of sound and cannot reach the surface in the few tenths of a second required for the core collapse to occur. Thus, the surface layers of our star hung briefly suspended, much like a cartoon character who dashes off the edge of a cliff and hangs momentarily in space before realizing that he is no longer held up by anything.

The collapse of the core continued until the densities rose to several times that of an atomic nucleus. The resistance to further collapse then became so great that the core rebounded. Infalling material ran into the “brick wall” of the rebounding core and was thrown outward with a great shock wave. Neutrinos poured out of the core, helping the shock wave blow the star apart. The shock reached the surface of the star a few hours later, and the star began to brighten into the supernova Ian Shelton observed in 1987.

The synthesis of heavy elements

The variations in the brightness of SN 1987A in the days and months after its discovery, which are shown in [link] , helped confirm our ideas about heavy element production. In a single day, the star soared in brightness by a factor of about 1000 and became just visible without a telescope. The star then continued to increase slowly in brightness until it was about the same apparent magnitude as the stars in the Little Dipper. Up until about day 40 after the outburst, the energy being radiated away was produced by the explosion itself. But then SN 1987A did not continue to fade away, as we might have expected the light from the explosion to do. Instead, SN 1987A remained bright as energy from newly created radioactive elements came into play.
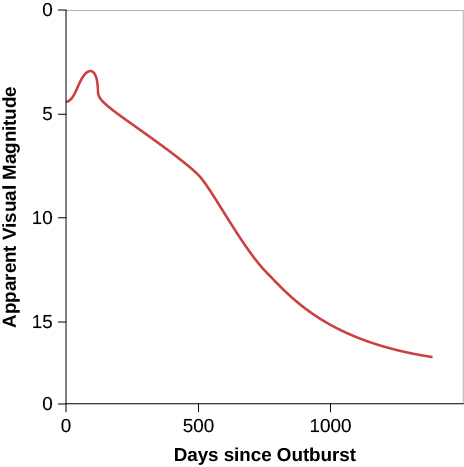
Change in the brightness of sn 1987a over time.

In this plot the vertical axis is labeled “Apparent visual magnitude”, and ranges from 19 at bottom to zero at top, in increments of one. The horizontal axis is labeled “Days since outburst”, and goes from zero at left to 1500 at right, in increments of 100 days. The data is plotted as a red curve beginning at zero days and magnitude 4.5, rises slightly to mag. 3 at 500 days, and steadily falls to mag. 17 at 1400 days.
Note how the rate of decline of the supernova’s light slowed between days 40 and 500. During this time, the brightness was mainly due to the energy emitted by newly formed (and quickly decaying) radioactive elements. Remember that magnitudes are a backward measure of brightness: the larger the magnitude, the dimmer the object looks.

Questions & Answers

Ayele, K., 2003. Introductory Economics, 3rd ed., Addis Ababa.
Widad Reply
can you send the book attached ?
Ariel
?
Ariel
What is economics
Widad Reply
the study of how humans make choices under conditions of scarcity
AI-Robot
U(x,y) = (x×y)1/2 find mu of x for y
Desalegn Reply
U(x,y) = (x×y)1/2 find mu of x for y
Desalegn
what is ecnomics
Jan Reply
this is the study of how the society manages it's scarce resources
Belonwu
what is macroeconomic
John Reply
macroeconomic is the branch of economics which studies actions, scale, activities and behaviour of the aggregate economy as a whole.
husaini
etc
husaini
difference between firm and industry
husaini Reply
what's the difference between a firm and an industry
Abdul
firm is the unit which transform inputs to output where as industry contain combination of firms with similar production 😅😅
Abdulraufu
Suppose the demand function that a firm faces shifted from Qd  120 3P to Qd  90  3P and the supply function has shifted from QS  20  2P to QS 10  2P . a) Find the effect of this change on price and quantity. b) Which of the changes in demand and supply is higher?
Toofiq Reply
explain standard reason why economic is a science
innocent Reply
factors influencing supply
Petrus Reply
what is economic.
Milan Reply
scares means__________________ends resources. unlimited
Jan
economics is a science that studies human behaviour as a relationship b/w ends and scares means which have alternative uses
Jan
calculate the profit maximizing for demand and supply
Zarshad Reply
Why qualify 28 supplies
Milan
what are explicit costs
Nomsa Reply
out-of-pocket costs for a firm, for example, payments for wages and salaries, rent, or materials
AI-Robot
concepts of supply in microeconomics
David Reply
economic overview notes
Amahle Reply
identify a demand and a supply curve
Salome Reply
i don't know
Parul
there's a difference
Aryan
Demand curve shows that how supply and others conditions affect on demand of a particular thing and what percent demand increase whith increase of supply of goods
Israr
Hi Sir please how do u calculate Cross elastic demand and income elastic demand?
Abari
Got questions? Join the online conversation and get instant answers!
Jobilize.com Reply

Get Jobilize Job Search Mobile App in your pocket Now!

Get it on Google Play Download on the App Store Now


Source:  OpenStax, Astronomy. OpenStax CNX. Apr 12, 2017 Download for free at http://cnx.org/content/col11992/1.13
Google Play and the Google Play logo are trademarks of Google Inc.

Notification Switch

Would you like to follow the 'Astronomy' conversation and receive update notifications?

Ask