<< Chapter < Page Chapter >> Page >

Learning objectives

By the end of this section, you will be able to:

  • Describe the observed features of SN 1987A both before and after the supernova
  • Explain how observations of various parts of the SN 1987A event helped confirm theories about supernovae

Supernovae were discovered long before astronomers realized that these spectacular cataclysms mark the death of stars (see Making Connections: Supernovae in History ). The word nova means “new” in Latin; before telescopes, when a star too dim to be seen with the unaided eye suddenly flared up in a brilliant explosion, observers concluded it must be a brand-new star. Twentieth-century astronomers reclassified the explosions with the greatest luminosity as super novae.

From historical records of such explosions, from studies of the remnants of supernovae in our Galaxy, and from analyses of supernovae in other galaxies, we estimate that, on average, one supernova explosion occurs somewhere in the Milky Way Galaxy every 25 to 100 years. Unfortunately, however, no supernova explosion has been observable in our Galaxy since the invention of the telescope. Either we have been exceptionally unlucky or, more likely, recent explosions have taken place in parts of the Galaxy where interstellar dust blocks light from reaching us.

Supernovae in history

Although many supernova explosions in our own Galaxy have gone unnoticed, a few were so spectacular that they were clearly seen and recorded by sky watchers and historians at the time. We can use these records, going back two millennia, to help us pinpoint where the exploding stars were and thus where to look for their remnants today.

The most dramatic supernova was observed in the year 1006. It appeared in May as a brilliant point of light visible during the daytime, perhaps 100 times brighter than the planet Venus. It was bright enough to cast shadows on the ground during the night and was recorded with awe and fear by observers all over Europe and Asia. No one had seen anything like it before; Chinese astronomers, noting that it was a temporary spectacle, called it a “guest star.”

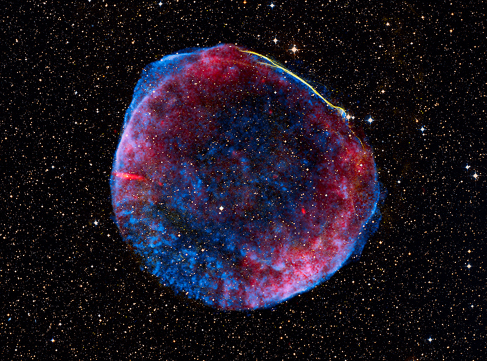
Astronomers David Clark and Richard Stephenson have scoured records from around the world to find more than 20 reports of the 1006 supernova ( SN 1006 ) ( [link] ). This has allowed them to determine with some accuracy where in the sky the explosion occurred. They place it in the modern constellation of Lupus; at roughly the position they have determined, we find a supernova remnant, now quite faint. From the way its filaments are expanding, it indeed appears to be about 1000 years old.

Supernova 1006 remnant.

Multi-wavelength Image of SN 1006. This nearly perfect spherical bubble of gas is seen here in X-rays (blue), visible (white-yellow) and radio light (red) against the background stars of the Milky Way.
This composite view of SN 1006 from the Chandra X-Ray Observatory shows the X-rays coming from the remnant in blue, visible light in white-yellow, and radio emission in red. (credit: modification of work by NASA, ESA, Zolt Levay(STScI))

Another guest star, now known as SN 1054 , was clearly recorded in Chinese records in July 1054. The remnant of that star is one of the most famous and best-studied objects in the sky, called the Crab Nebula ( [link] ). It is a marvelously complex object, which has been key to understanding the death of massive stars. When its explosion was first seen, we estimate that it was about as bright as the planet Jupiter: nowhere near as dazzling as the 1006 event but still quite dramatic to anyone who kept track of objects in the sky. Another fainter supernova was seen in 1181.

The next supernova became visible in November 1572 and, being brighter than the planet Venus, was quickly spotted by a number of observers, including the young Tycho Brahe (see Orbits and Gravity ). His careful measurements of the star over a year and a half showed that it was not a comet or something in Earth’s atmosphere since it did not move relative to the stars. He correctly deduced that it must be a phenomenon belonging to the realm of the stars, not of the solar system. The remnant of Tycho’s Supernova (as it is now called) can still be detected in many different bands of the electromagnetic spectrum.

Not to be outdone, Johannes Kepler , Tycho Brahe’s scientific heir, found his own supernova in 1604, now known as Kepler’s Supernova ( [link] ). Fainter than Tycho’s, it nevertheless remained visible for about a year. Kepler wrote a book about his observations that was read by many with an interest in the heavens, including Galileo.

No supernova has been spotted in our Galaxy for the past 300 years. Since the explosion of a visible supernova is a chance event, there is no way to say when the next one might occur. Around the world, dozens of professional and amateur astronomers keep a sharp lookout for “new” stars that appear overnight, hoping to be the first to spot the next guest star in our sky and make a little history themselves.

Questions & Answers

What are the factors that affect demand for a commodity
Florence Reply
differentiate between demand and supply giving examples
Lambiv Reply
differentiated between demand and supply using examples
Lambiv
what is labour ?
Lambiv
how will I do?
Venny Reply
how is the graph works?I don't fully understand
Rezat Reply
information
Eliyee
devaluation
Eliyee
t
WARKISA
hi guys good evening to all
Lambiv
multiple choice question
Aster Reply
appreciation
Eliyee
explain perfect market
Lindiwe Reply
In economics, a perfect market refers to a theoretical construct where all participants have perfect information, goods are homogenous, there are no barriers to entry or exit, and prices are determined solely by supply and demand. It's an idealized model used for analysis,
Ezea
What is ceteris paribus?
Shukri Reply
other things being equal
AI-Robot
When MP₁ becomes negative, TP start to decline. Extuples Suppose that the short-run production function of certain cut-flower firm is given by: Q=4KL-0.6K2 - 0.112 • Where is quantity of cut flower produced, I is labour input and K is fixed capital input (K-5). Determine the average product of lab
Kelo
Extuples Suppose that the short-run production function of certain cut-flower firm is given by: Q=4KL-0.6K2 - 0.112 • Where is quantity of cut flower produced, I is labour input and K is fixed capital input (K-5). Determine the average product of labour (APL) and marginal product of labour (MPL)
Kelo
yes,thank you
Shukri
Can I ask you other question?
Shukri
what is monopoly mean?
Habtamu Reply
What is different between quantity demand and demand?
Shukri Reply
Quantity demanded refers to the specific amount of a good or service that consumers are willing and able to purchase at a give price and within a specific time period. Demand, on the other hand, is a broader concept that encompasses the entire relationship between price and quantity demanded
Ezea
ok
Shukri
how do you save a country economic situation when it's falling apart
Lilia Reply
what is the difference between economic growth and development
Fiker Reply
Economic growth as an increase in the production and consumption of goods and services within an economy.but Economic development as a broader concept that encompasses not only economic growth but also social & human well being.
Shukri
production function means
Jabir
What do you think is more important to focus on when considering inequality ?
Abdisa Reply
any question about economics?
Awais Reply
sir...I just want to ask one question... Define the term contract curve? if you are free please help me to find this answer 🙏
Asui
it is a curve that we get after connecting the pareto optimal combinations of two consumers after their mutually beneficial trade offs
Awais
thank you so much 👍 sir
Asui
In economics, the contract curve refers to the set of points in an Edgeworth box diagram where both parties involved in a trade cannot be made better off without making one of them worse off. It represents the Pareto efficient allocations of goods between two individuals or entities, where neither p
Cornelius
In economics, the contract curve refers to the set of points in an Edgeworth box diagram where both parties involved in a trade cannot be made better off without making one of them worse off. It represents the Pareto efficient allocations of goods between two individuals or entities,
Cornelius
Suppose a consumer consuming two commodities X and Y has The following utility function u=X0.4 Y0.6. If the price of the X and Y are 2 and 3 respectively and income Constraint is birr 50. A,Calculate quantities of x and y which maximize utility. B,Calculate value of Lagrange multiplier. C,Calculate quantities of X and Y consumed with a given price. D,alculate optimum level of output .
Feyisa Reply
Answer
Feyisa
c
Jabir
the market for lemon has 10 potential consumers, each having an individual demand curve p=101-10Qi, where p is price in dollar's per cup and Qi is the number of cups demanded per week by the i th consumer.Find the market demand curve using algebra. Draw an individual demand curve and the market dema
Gsbwnw Reply
suppose the production function is given by ( L, K)=L¼K¾.assuming capital is fixed find APL and MPL. consider the following short run production function:Q=6L²-0.4L³ a) find the value of L that maximizes output b)find the value of L that maximizes marginal product
Abdureman
Got questions? Join the online conversation and get instant answers!
Jobilize.com Reply

Get Jobilize Job Search Mobile App in your pocket Now!

Get it on Google Play Download on the App Store Now


Source:  OpenStax, Astronomy. OpenStax CNX. Apr 12, 2017 Download for free at http://cnx.org/content/col11992/1.13
Google Play and the Google Play logo are trademarks of Google Inc.

Notification Switch

Would you like to follow the 'Astronomy' conversation and receive update notifications?

Ask