<< Chapter < Page Chapter >> Page >

Learning objectives

By the end of this section, you will be able to:

  • Explain how the H–R diagram    of a star cluster can be related to the cluster’s age and the stages of evolution of its stellar members
  • Describe how the main-sequence turnoff of a cluster reveals its age

In the previous section, we indicated that that open clusters are younger than globular clusters, and associations are typically even younger. In this section, we will show how we determine the ages of these star clusters. The key observation is that the stars in these different types of clusters are found in different places in the H–R diagram, and we can use their locations in the diagram in combination with theoretical calculations to estimate how long they have lived.

H–r diagrams of young clusters

What does theory predict for the H–R diagram of a cluster whose stars have recently condensed from an interstellar cloud? Remember that at every stage of evolution, massive stars evolve more quickly than their lower-mass counterparts. After a few million years (“recently” for astronomers), the most massive stars should have completed their contraction phase and be on the main sequence, while the less massive ones should be off to the right, still on their way to the main sequence. These ideas are illustrated in [link] , which shows the H–R diagram calculated by R. Kippenhahn and his associates at Munich University for a hypothetical cluster with an age of 3 million years.

Young cluster h–r diagram.

Hypothetical H-R Diagram of a Young Cluster. In this plot titled “M 2001 Age: 3 million years,” the vertical axis is labeled “Luminosity (LSun),” and goes from 0.1 at the bottom to 100,000 at the top. The horizontal axis is labeled “Surface Temperature (K)”, and goes from 40,000 on the left to 3,000 on the right. The zero-age main sequence is drawn as a red diagonal line starting just above 100,000 LSun at the top of the graph down to about 4000 K at the bottom. The “Present position of Sun” is indicated at 5500 K and 1 LSun. Over-plotted on the graph are black dots representing the individual stars in the cluster. About half of the dots lie neatly along the red line until about 10000 K and 100 LSun. At this point, the remainder of the dots lie above the red line, meaning these stars have yet to reach the main sequence.
We see an H–R diagram for a hypothetical young cluster with an age of 3 million years. Note that the high-mass (high-luminosity) stars have already arrived at the main-sequence stage of their lives, while the lower-mass (lower-luminosity) stars are still contracting toward the zero-age main sequence (the red line) and are not yet hot enough to derive all of their energy from the fusion of hydrogen.

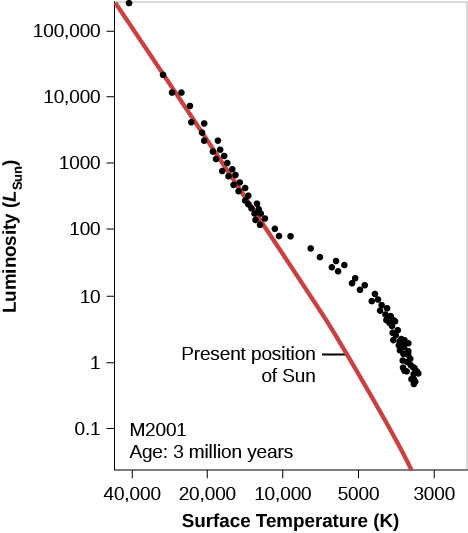
There are real star clusters that fit this description. The first to be studied (in about 1950) was NGC 2264, which is still associated with the region of gas and dust from which it was born ( [link] ).

Young cluster ngc 2264.

Image of the Young Cluster N G C 2264. This youthful cluster derives its name from the shape outlined by its brightest stars. The “Christmas Tree” is upside down in this image. The brightest star at the top of the frame is the base of the tree. The top of the tree is the star above the dark v-shaped lane in the nebula just left of the center at the bottom of the image.
Located about 2600 light-years from us, this region of newly formed stars, known as the Christmas Tree Cluster, is a complex mixture of hydrogen gas (which is ionized by hot embedded stars and shown in red), dark obscuring dust lanes, and brilliant young stars. The image shows a scene about 30 light-years across. (credit: ESO)

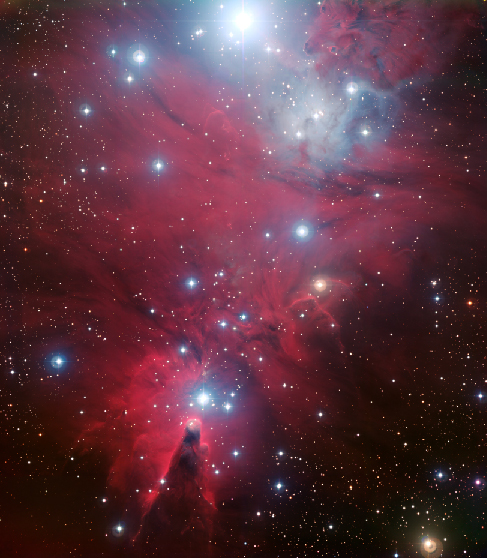
The NGC 2264 cluster’s H–R diagram is shown in [link] . The cluster in the middle of the Orion Nebula (shown in [link] and [link] ) is in a similar stage of evolution.

Ngc 2264 h–r diagram.

In this plot the vertical axis is labeled “Luminosity (LSun)” and goes from 0.1 at the bottom to 100,000 at the top. The horizontal axis is labeled “Surface Temperature (K)” and goes from 40,000 on the left to 3,000 on the right. The zero-age main sequence is drawn as a red diagonal line starting just above 100,000 LSun at the top of the graph down to about 4000 K at the bottom. Over plotted are the observed values of stars in N G C 2264, shown as black dots. Stars lie on the line until about 10000 K and 10 LSun, below which the stars reside above the main sequence.
Compare this H–R diagram to that in [link] ; although the points scatter a bit more here, the theoretical and observational diagrams are remarkably, and satisfyingly, similar.

As clusters get older, their H–R diagrams begin to change. After a short time (less than a million years after they reach the main sequence), the most massive stars use up the hydrogen in their cores and evolve off the main sequence to become red giants and supergiants. As more time passes, stars of lower mass begin to leave the main sequence and make their way to the upper right of the H–R diagram.

Questions & Answers

how does Neisseria cause meningitis
Nyibol Reply
what is microbiologist
Muhammad Reply
what is errata
Muhammad
is the branch of biology that deals with the study of microorganisms.
Ntefuni Reply
What is microbiology
Mercy Reply
studies of microbes
Louisiaste
when we takee the specimen which lumbar,spin,
Ziyad Reply
How bacteria create energy to survive?
Muhamad Reply
Bacteria doesn't produce energy they are dependent upon their substrate in case of lack of nutrients they are able to make spores which helps them to sustain in harsh environments
_Adnan
But not all bacteria make spores, l mean Eukaryotic cells have Mitochondria which acts as powerhouse for them, since bacteria don't have it, what is the substitution for it?
Muhamad
they make spores
Louisiaste
what is sporadic nd endemic, epidemic
Aminu Reply
the significance of food webs for disease transmission
Abreham
food webs brings about an infection as an individual depends on number of diseased foods or carriers dully.
Mark
explain assimilatory nitrate reduction
Esinniobiwa Reply
Assimilatory nitrate reduction is a process that occurs in some microorganisms, such as bacteria and archaea, in which nitrate (NO3-) is reduced to nitrite (NO2-), and then further reduced to ammonia (NH3).
Elkana
This process is called assimilatory nitrate reduction because the nitrogen that is produced is incorporated in the cells of microorganisms where it can be used in the synthesis of amino acids and other nitrogen products
Elkana
Examples of thermophilic organisms
Shu Reply
Give Examples of thermophilic organisms
Shu
advantages of normal Flora to the host
Micheal Reply
Prevent foreign microbes to the host
Abubakar
they provide healthier benefits to their hosts
ayesha
They are friends to host only when Host immune system is strong and become enemies when the host immune system is weakened . very bad relationship!
Mark
what is cell
faisal Reply
cell is the smallest unit of life
Fauziya
cell is the smallest unit of life
Akanni
ok
Innocent
cell is the structural and functional unit of life
Hasan
is the fundamental units of Life
Musa
what are emergency diseases
Micheal Reply
There are nothing like emergency disease but there are some common medical emergency which can occur simultaneously like Bleeding,heart attack,Breathing difficulties,severe pain heart stock.Hope you will get my point .Have a nice day ❣️
_Adnan
define infection ,prevention and control
Innocent
I think infection prevention and control is the avoidance of all things we do that gives out break of infections and promotion of health practices that promote life
Lubega
Heyy Lubega hussein where are u from?
_Adnan
en français
Adama
which site have a normal flora
ESTHER Reply
Many sites of the body have it Skin Nasal cavity Oral cavity Gastro intestinal tract
Safaa
skin
Asiina
skin,Oral,Nasal,GIt
Sadik
How can Commensal can Bacteria change into pathogen?
Sadik
How can Commensal Bacteria change into pathogen?
Sadik
all
Tesfaye
by fussion
Asiina
what are the advantages of normal Flora to the host
Micheal
what are the ways of control and prevention of nosocomial infection in the hospital
Micheal
what is inflammation
Shelly Reply
part of a tissue or an organ being wounded or bruised.
Wilfred
what term is used to name and classify microorganisms?
Micheal Reply
Binomial nomenclature
adeolu
Got questions? Join the online conversation and get instant answers!
Jobilize.com Reply
Practice Key Terms 1

Get Jobilize Job Search Mobile App in your pocket Now!

Get it on Google Play Download on the App Store Now


Source:  OpenStax, Astronomy. OpenStax CNX. Apr 12, 2017 Download for free at http://cnx.org/content/col11992/1.13
Google Play and the Google Play logo are trademarks of Google Inc.

Notification Switch

Would you like to follow the 'Astronomy' conversation and receive update notifications?

Ask